Unlock a world of possibilities! Login now and discover the exclusive benefits awaiting you.
- Qlik Community
- :
- All Forums
- :
- QlikView App Dev
- :
- Set Analysis Syntax
- Subscribe to RSS Feed
- Mark Topic as New
- Mark Topic as Read
- Float this Topic for Current User
- Bookmark
- Subscribe
- Mute
- Printer Friendly Page
- Mark as New
- Bookmark
- Subscribe
- Mute
- Subscribe to RSS Feed
- Permalink
- Report Inappropriate Content
Set Analysis Syntax
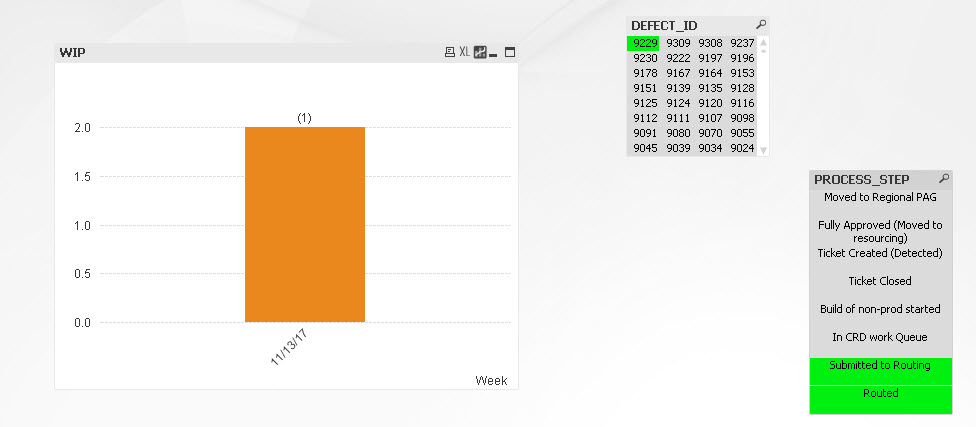
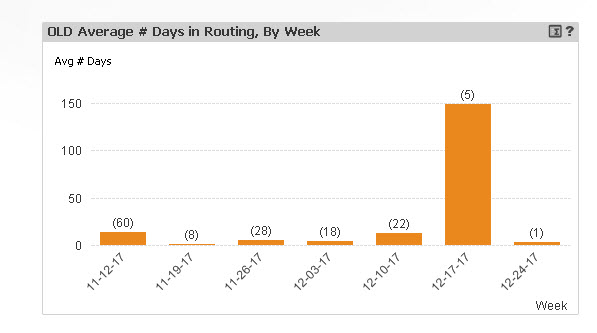
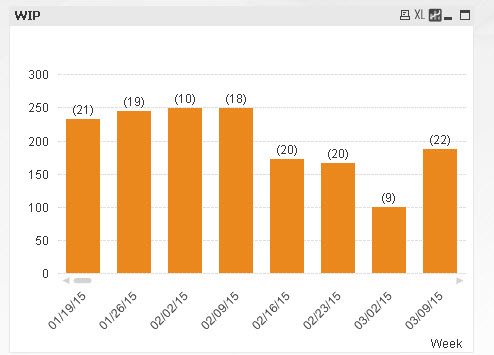
My OLD Chart is not showing the right date on the X-Axis. When I update it in the WIP chart, I lose my look back of 8 weeks. How do I update both expressions to only show the last 8 weeks like the OLD chart and still include the logic from the old expressions on PROCESS_STEP = {'Submitted to Routing', 'Routed'}, IS_IN_PROD = {'Y'}?
An example if DEFECT_ID = 9229 and it should show Avg Days = 2 and Ticket = 1 but without having to select PROCESS_STEP.
OLD and incorrect Dimension: =date(WEEK_START, 'MM-DD-YY')
OLD Expression for # Tickets: (Count({$<
PROCESS_STEP = {'Submitted to Routing', 'Routed'},
IS_IN_PROD = {'Y'},
MONTH_1 = {"$(='>=' & Date(MonthStart(Max({<PROCESS_STEP = {'Submitted to Routing', 'Routed'}>}MONTH_1), -2), 'MM-YY') & '<' & Date(MonthStart(Max({<PROCESS_STEP = {'Submitted to Routing', 'Routed'}>}MONTH_1), 0), 'MM-YY'))"}>} DISTINCT
DEFECT_ID))
OLD Expression for Avg Days: sum({$<
PROCESS_STEP = {'Submitted to Routing', 'Routed'},
IS_IN_PROD = {'Y'},
MONTH_1 = {"$(='>=' & Date(MonthStart(Max({<PROCESS_STEP = {'Submitted to Routing', 'Routed'}>}MONTH_1), -2), 'MM-YY') & '<' & Date(MonthStart(Max({<PROCESS_STEP = {'Submitted to Routing', 'Routed'}>}MONTH_1), 0), 'MM-YY'))"}>}
Aggr(Max({$<
PROCESS_STEP = {'Submitted to Routing', 'Routed'},
IS_IN_PROD = {'Y'},
MONTH_1 = {"$(='>=' & Date(MonthStart(Max({<PROCESS_STEP = {'Submitted to Routing', 'Routed'}>}MONTH_1), -2), 'MM-YY') & '<' & Date(MonthStart(Max({<PROCESS_STEP = {'Submitted to Routing', 'Routed'}>}MONTH_1), 0), 'MM-YY'))"}>}
PROCESS_STEP_START_DATE) -
Min({$<
PROCESS_STEP = {'Submitted to Routing', 'Routed'},
IS_IN_PROD = {'Y'},
MONTH_1 = {"$(='>=' & Date(MonthStart(Max({<PROCESS_STEP = {'Submitted to Routing', 'Routed'}>}MONTH_1), -2), 'MM-YY') & '<' & Date(MonthStart(Max({<PROCESS_STEP = {'Submitted to Routing', 'Routed'}>}MONTH_1), 0), 'MM-YY'))"}>}
PROCESS_STEP_START_DATE)
, DEFECT_ID))/
(Count({$<
PROCESS_STEP = {'Submitted to Routing', 'Routed'},
IS_IN_PROD = {'Y'},
MONTH_1 = {"$(='>=' & Date(MonthStart(Max({<PROCESS_STEP = {'Submitted to Routing', 'Routed'}>}MONTH_1), -2), 'MM-YY') & '<' & Date(MonthStart(Max({<PROCESS_STEP = {'Submitted to Routing', 'Routed'}>}MONTH_1), 0), 'MM-YY'))"}>} DISTINCT
DEFECT_ID))
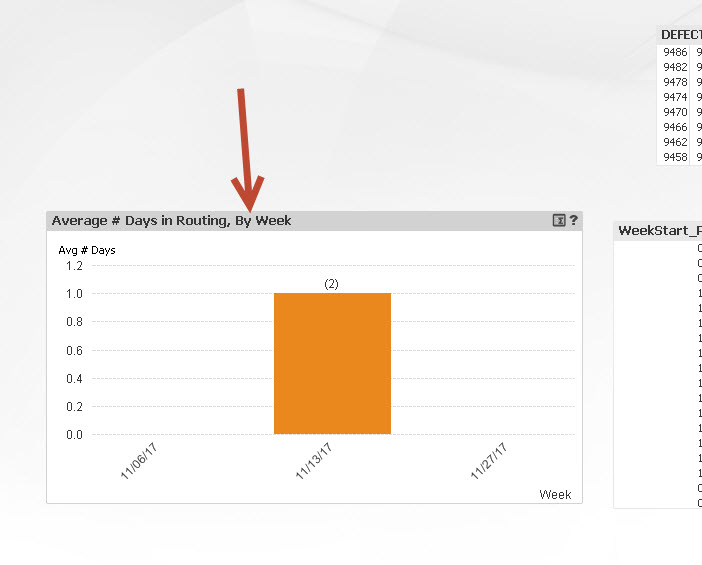
New Dimension: =weekstart(PROCESS_STEP_START_DATE)
Expression for # Tickets:
Expression for Avg Days:
- « Previous Replies
-
- 1
- 2
- Next Replies »
- Mark as New
- Bookmark
- Subscribe
- Mute
- Subscribe to RSS Feed
- Permalink
- Report Inappropriate Content
One of the additional problems is that I have a lot of date differences that end up as 0 so there is no bar for that month and you also can't see the number of tickets.
- Mark as New
- Bookmark
- Subscribe
- Mute
- Subscribe to RSS Feed
- Permalink
- Report Inappropriate Content
But where is the chart that uses the expression? Sorry, but I am not able to find it... would you be able to take a snapshot and let me know where exactly am I looking 
- Mark as New
- Bookmark
- Subscribe
- Mute
- Subscribe to RSS Feed
- Permalink
- Report Inappropriate Content
- « Previous Replies
-
- 1
- 2
- Next Replies »