Unlock a world of possibilities! Login now and discover the exclusive benefits awaiting you.
- Qlik Community
- :
- All Forums
- :
- QlikView App Dev
- :
- Set Analysis for Comparison
- Subscribe to RSS Feed
- Mark Topic as New
- Mark Topic as Read
- Float this Topic for Current User
- Bookmark
- Subscribe
- Mute
- Printer Friendly Page
- Mark as New
- Bookmark
- Subscribe
- Mute
- Subscribe to RSS Feed
- Permalink
- Report Inappropriate Content
Set Analysis for Comparison
Hi All,
I need your assistance, i am facing one issue regarding "set analysis in pie chart" i.e
which product sold greater than 10,000 in 2012 and 2013
for instance,
Product Sales in2012 Sales in 2013
Dell 20000 16000
lenova 15000 10000
Acer 12000 8000
Sony 9000 6000
I need to know comparison in % on Pie Chart for 2012 and 2013
Thanks and Regards
Nihhal
- Tags:
- new_to_qlikview
- Mark as New
- Bookmark
- Subscribe
- Mute
- Subscribe to RSS Feed
- Permalink
- Report Inappropriate Content
Hi,
See attached. Here's the set:
sum({<[Sales in 2013] = {'>10000'}>}[Sales in 2013]) +
sum({<[Sales in2012] = {'>10000'}>}[Sales in2012])
Best,
Matt
- Mark as New
- Bookmark
- Subscribe
- Mute
- Subscribe to RSS Feed
- Permalink
- Report Inappropriate Content
Hi matthew, Thanks for reply
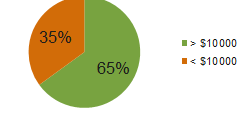
My requirment is comaparison between 2012 and 2013 means pie chart want to show only 2012 and 2013 value is in %
like image
Regards,
Nihhal
- Mark as New
- Bookmark
- Subscribe
- Mute
- Subscribe to RSS Feed
- Permalink
- Report Inappropriate Content
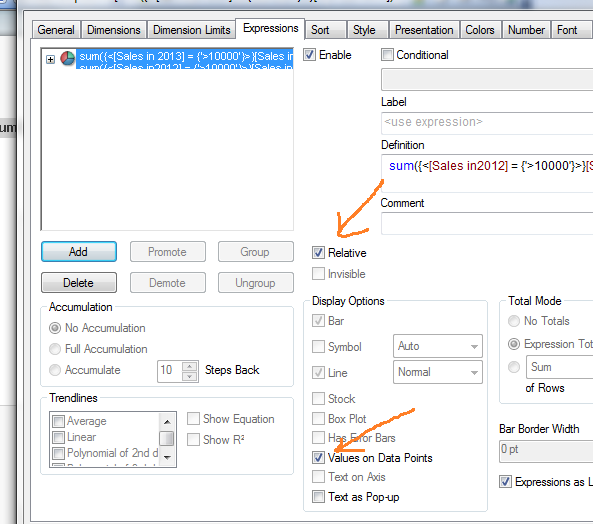
Expression tab- > Check 'Relative' and Check 'Values on Data Points'
- Mark as New
- Bookmark
- Subscribe
- Mute
- Subscribe to RSS Feed
- Permalink
- Report Inappropriate Content
Hi,
If you want to compare 2012 with 2013 in the pie chart, don't sum both values. Put the 2013 data in one expression, and the 2012 data in another different expression (just the way matthew posted). Don't pick any dimension for the pie chart.
- Mark as New
- Bookmark
- Subscribe
- Mute
- Subscribe to RSS Feed
- Permalink
- Report Inappropriate Content
Hi Nihhal
Here with I have modified the object. Have a look and let me know.
-Jay
- Mark as New
- Bookmark
- Subscribe
- Mute
- Subscribe to RSS Feed
- Permalink
- Report Inappropriate Content
Hi tresesco
Pie chart want to show two values only one is which product sold >10000 and second is <10000 for 2012 as well as 2013 by clicking year, please see image
- Mark as New
- Bookmark
- Subscribe
- Mute
- Subscribe to RSS Feed
- Permalink
- Report Inappropriate Content
Hi jaya Thank you i got solution almost by your attachment please let me know how i display value(like % value) inside Pie Chart like my image
- Mark as New
- Bookmark
- Subscribe
- Mute
- Subscribe to RSS Feed
- Permalink
- Report Inappropriate Content
Hi Nihhal,
It is not possible to display values inside pie. You can display outside the pie or in the legend. Hope this helps you.
Regards,
Jagan.
- Mark as New
- Bookmark
- Subscribe
- Mute
- Subscribe to RSS Feed
- Permalink
- Report Inappropriate Content
The only way to achieve that is with an extension. Check out:
PieChart Visualization for Google BigQuery
Or using the Whisker Pie Chart extension, that is already installed in Qlikview.