Unlock a world of possibilities! Login now and discover the exclusive benefits awaiting you.
- Qlik Community
- :
- All Forums
- :
- QlikView App Dev
- :
- Set Analysis problem with Chart Figures Associatio...
- Subscribe to RSS Feed
- Mark Topic as New
- Mark Topic as Read
- Float this Topic for Current User
- Bookmark
- Subscribe
- Mute
- Printer Friendly Page
- Mark as New
- Bookmark
- Subscribe
- Mute
- Subscribe to RSS Feed
- Permalink
- Report Inappropriate Content
Set Analysis problem with Chart Figures Association
Hi Everyone,
Just want to ask if you guys have workarounds or suggestion to fix my problem,
I have this expression with set analysis below on a variable (vPRCount)
- Count({$<[PRPO PR Status] = -{'No PR'}>} DISTINCT [PRNo.])
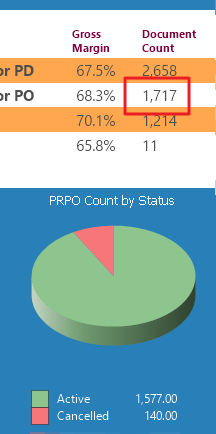
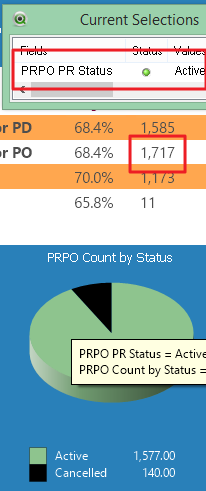
then I have a Pie chart which uses the same field([PRPO PR Status]) above as its dimension and the variable(vPRCount) as its expression. The expression works and calculate properly but my problem is when I select a data in the field([PRPO PR Status]) the chart object is not associating with the selection.
For reference please see screenshots below of the object with and without the selection
Thanks !
Regards,
Charles
- Tags:
- new_to_qlikview
Accepted Solutions
- Mark as New
- Bookmark
- Subscribe
- Mute
- Subscribe to RSS Feed
- Permalink
- Report Inappropriate Content
I guess negation symbol is misplaced for that desired behavior, it should come before '=' sign. Try:
Count({$<[PRPO PR Status] -={'No PR'}>} DISTINCT [PRNo.])
- Mark as New
- Bookmark
- Subscribe
- Mute
- Subscribe to RSS Feed
- Permalink
- Report Inappropriate Content
I guess negation symbol is misplaced for that desired behavior, it should come before '=' sign. Try:
Count({$<[PRPO PR Status] -={'No PR'}>} DISTINCT [PRNo.])