Unlock a world of possibilities! Login now and discover the exclusive benefits awaiting you.
- Qlik Community
- :
- All Forums
- :
- QlikView App Dev
- :
- Set Analysis?
- Subscribe to RSS Feed
- Mark Topic as New
- Mark Topic as Read
- Float this Topic for Current User
- Bookmark
- Subscribe
- Mute
- Printer Friendly Page
- Mark as New
- Bookmark
- Subscribe
- Mute
- Subscribe to RSS Feed
- Permalink
- Report Inappropriate Content
Set Analysis?
Hi
I am trying to create a chart that shows 3 figures:
The number of donors that have given to an appeal
The number of donors that have given to an appeal and only to this appeal
The number of donors that have given to an appeal and another appeal.
I have attached a simplified example,
with this data:
Load * inline
[
GiftID, Donor, Appeal
0001, 1, Appeal_A,
0002, 1, Appeal_B,
0003, 1, Appeal_A,
0004, 2, Appeal_A,
0007, 3, Appeal_A,
0008, 3, Appeal_A,
0009, 3, Appeal_A,
0010, 3, Appeal_B,
0011, 3, Appeal_B,
0012, 4, Appeal_A,
0013, 4, Appeal_A,
0014, 5, Appeal_B,
0015, 5, Appeal_B,
0016, 5, Appeal_B,
0017, 6, Appeal_C
];
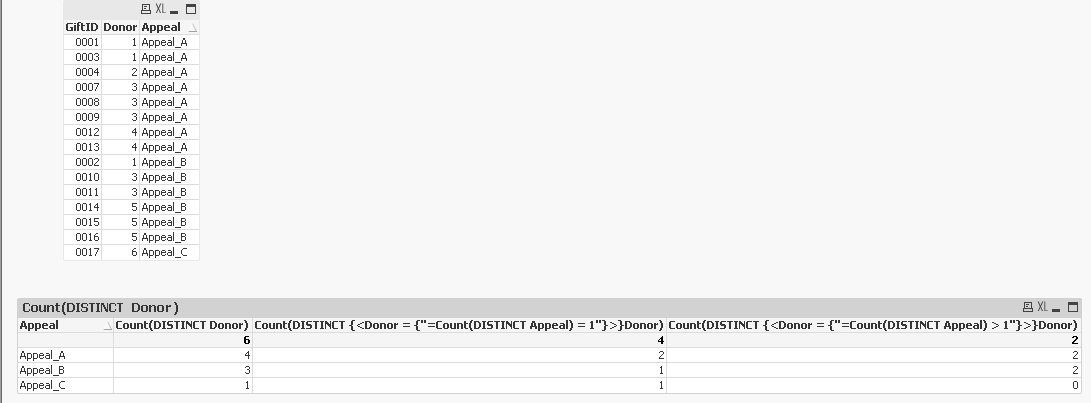
I would like the chart to show
Given to this Appeal Given Only to this Appeal Given to this Appeal and other Appeal
AppealA 4 2 2
AppealB 3 1 2
AppealC 1 1 0
Any help much appreciated.
David
- Tags:
- new_to_qlikview
Accepted Solutions
- Mark as New
- Bookmark
- Subscribe
- Mute
- Subscribe to RSS Feed
- Permalink
- Report Inappropriate Content
Try these expressions:
Count(DISTINCT Donor)
Count(DISTINCT {<Donor = {"=Count(DISTINCT Appeal) = 1"}>}Donor)
Count(DISTINCT {<Donor = {"=Count(DISTINCT Appeal) > 1"}>}Donor)
- Mark as New
- Bookmark
- Subscribe
- Mute
- Subscribe to RSS Feed
- Permalink
- Report Inappropriate Content
Try these expressions:
Count(DISTINCT Donor)
Count(DISTINCT {<Donor = {"=Count(DISTINCT Appeal) = 1"}>}Donor)
Count(DISTINCT {<Donor = {"=Count(DISTINCT Appeal) > 1"}>}Donor)
- Mark as New
- Bookmark
- Subscribe
- Mute
- Subscribe to RSS Feed
- Permalink
- Report Inappropriate Content
Thank you Sunny T
That gives me to right answer, but I should have said that the "The number of donors that have given to an appeal and another appeal". needs to include all appeals not just the selected appeals.
So if I select AppealA the chart would still show 4 2 2 for that appeal. Rather than 4 4 0
- Mark as New
- Bookmark
- Subscribe
- Mute
- Subscribe to RSS Feed
- Permalink
- Report Inappropriate Content
Add set analysis to your search string to ignore selection in Appeal.
=Count(DISTINCT {<Donor = {"=Count(DISTINCT {<Appeal>}Appeal) = 1"}>}Donor)
=Count(DISTINCT {<Donor = {"=Count(DISTINCT {<Appeal>}Appeal) > 1"}>}Donor)
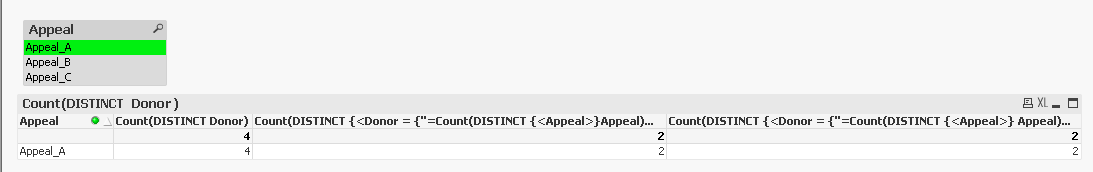
UPDATE: Sample attached for reference
- Mark as New
- Bookmark
- Subscribe
- Mute
- Subscribe to RSS Feed
- Permalink
- Report Inappropriate Content
Thanks again Sunny T
That gives me exactly what I need.
I really appreciate your time on this.
Best wishes
David
- Mark as New
- Bookmark
- Subscribe
- Mute
- Subscribe to RSS Feed
- Permalink
- Report Inappropriate Content
No problem David, I am glad I was able to help 