Unlock a world of possibilities! Login now and discover the exclusive benefits awaiting you.
- Qlik Community
- :
- All Forums
- :
- QlikView App Dev
- :
- Set analysis and intersect
- Subscribe to RSS Feed
- Mark Topic as New
- Mark Topic as Read
- Float this Topic for Current User
- Bookmark
- Subscribe
- Mute
- Printer Friendly Page
- Mark as New
- Bookmark
- Subscribe
- Mute
- Subscribe to RSS Feed
- Permalink
- Report Inappropriate Content
Set analysis and intersect
Dear All,
I used set analysis to avoid showing one value , take a look to the below picture :
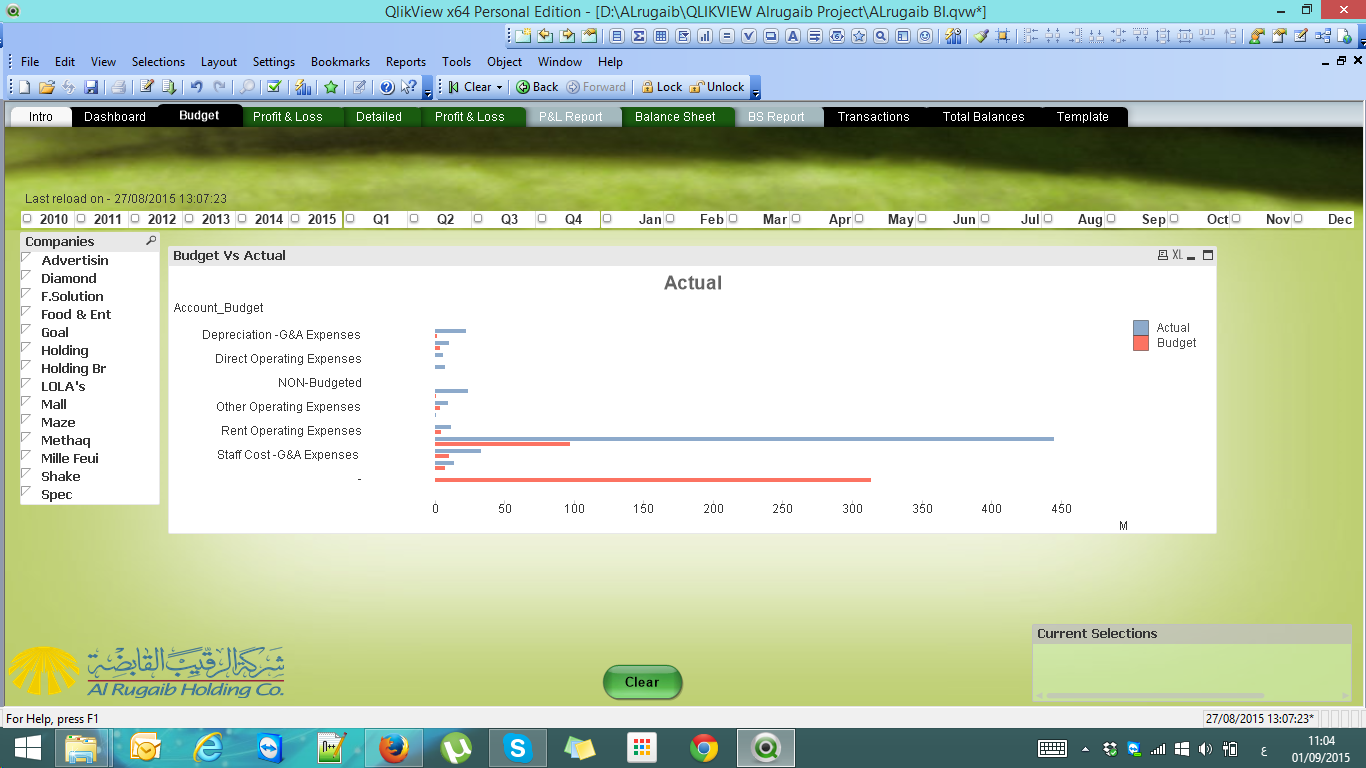
I don't want (NON-Budgeted ) to appear on this chart, so I used the below Set Analysis:
Sum({$<Account_Budget -= {'NON-Budgeted','-','0'}>} balance)
this hide the value of (NON-Budgeted) but the label is still shown on the chart, what could I do?
Regards
- « Previous Replies
-
- 1
- 2
- Next Replies »
Accepted Solutions
- Mark as New
- Bookmark
- Subscribe
- Mute
- Subscribe to RSS Feed
- Permalink
- Report Inappropriate Content
change Account_Budget dimension to a calculated dimension with an if condition like
if(Account_Budget='ON-Budgeted','',Account_Budget)
hth
Sasi
- Mark as New
- Bookmark
- Subscribe
- Mute
- Subscribe to RSS Feed
- Permalink
- Report Inappropriate Content
That should be:
Sum({$<Account_Budget -= {'NON-Budgeted'}>} balance)
(the other values wont do anything useful)
I suggest that you post your qvw or a representative sample.
- Mark as New
- Bookmark
- Subscribe
- Mute
- Subscribe to RSS Feed
- Permalink
- Report Inappropriate Content
In your graph I see more then 2 bars for each label.... could you explain better? Maybe the label is referred to some other value...
- Mark as New
- Bookmark
- Subscribe
- Mute
- Subscribe to RSS Feed
- Permalink
- Report Inappropriate Content
also I need it without 0 or -
- Mark as New
- Bookmark
- Subscribe
- Mute
- Subscribe to RSS Feed
- Permalink
- Report Inappropriate Content
find the application below here
https://www.dropbox.com/s/g9s1n0509ppa3sq/ALrugaib%20BI.qvw?dl=0
- Mark as New
- Bookmark
- Subscribe
- Mute
- Subscribe to RSS Feed
- Permalink
- Report Inappropriate Content
find the application below here
https://www.dropbox.com/s/g9s1n0509ppa3sq/ALrugaib%20BI.qvw?dl=0
- Mark as New
- Bookmark
- Subscribe
- Mute
- Subscribe to RSS Feed
- Permalink
- Report Inappropriate Content
change Account_Budget dimension to a calculated dimension with an if condition like
if(Account_Budget='ON-Budgeted','',Account_Budget)
hth
Sasi
- Mark as New
- Bookmark
- Subscribe
- Mute
- Subscribe to RSS Feed
- Permalink
- Report Inappropriate Content
If you delete the set analysis, you can see the null dimension anyway...!!
The problem seems to be the dimension and not the expression... could be?
- Mark as New
- Bookmark
- Subscribe
- Mute
- Subscribe to RSS Feed
- Permalink
- Report Inappropriate Content
Hi,
I think you need to select Supress Null value in Dimension as well as Presentation tab.
Hope this helps you.
Regards,
Jagan.
- Mark as New
- Bookmark
- Subscribe
- Mute
- Subscribe to RSS Feed
- Permalink
- Report Inappropriate Content
I didn't got you friend , sorry
- « Previous Replies
-
- 1
- 2
- Next Replies »