Unlock a world of possibilities! Login now and discover the exclusive benefits awaiting you.
- Qlik Community
- :
- All Forums
- :
- QlikView App Dev
- :
- Set analysis in a table
Options
- Subscribe to RSS Feed
- Mark Topic as New
- Mark Topic as Read
- Float this Topic for Current User
- Bookmark
- Subscribe
- Mute
- Printer Friendly Page
Turn on suggestions
Auto-suggest helps you quickly narrow down your search results by suggesting possible matches as you type.
Showing results for
Not applicable
2014-06-25
10:58 AM
- Mark as New
- Bookmark
- Subscribe
- Mute
- Subscribe to RSS Feed
- Permalink
- Report Inappropriate Content
Set analysis in a table
Hello everyone,
I need your help about a set analysis in a table.
I modeled my table in QlikView to Excel to explain.
Actually, I can display the content I want (columns A to F are Dimensions), only with adding an expression contening my Set Analysis (column G in Excel).
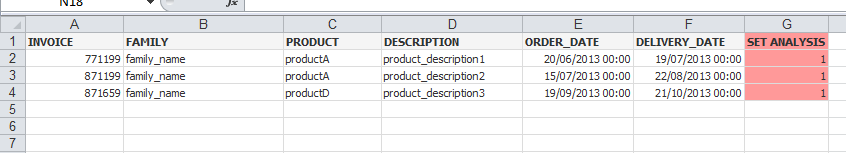
Do you know how I can display only the lines responding to the set analysis, without display the column G ?
Thanks for your help 
587 Views
1 Solution
Accepted Solutions
Partner - Champion III
2014-06-25
11:04 AM
- Mark as New
- Bookmark
- Subscribe
- Mute
- Subscribe to RSS Feed
- Permalink
- Report Inappropriate Content
in the presentation tab of your chart select the column you want and hide it
452 Views
2 Replies
Partner - Champion III
2014-06-25
11:04 AM
- Mark as New
- Bookmark
- Subscribe
- Mute
- Subscribe to RSS Feed
- Permalink
- Report Inappropriate Content
in the presentation tab of your chart select the column you want and hide it
453 Views
Not applicable
2014-06-26
03:03 AM
Author
- Mark as New
- Bookmark
- Subscribe
- Mute
- Subscribe to RSS Feed
- Permalink
- Report Inappropriate Content
Thanks
452 Views