Unlock a world of possibilities! Login now and discover the exclusive benefits awaiting you.
- Qlik Community
- :
- All Forums
- :
- QlikView App Dev
- :
- Set analysis
- Subscribe to RSS Feed
- Mark Topic as New
- Mark Topic as Read
- Float this Topic for Current User
- Bookmark
- Subscribe
- Mute
- Printer Friendly Page
- Mark as New
- Bookmark
- Subscribe
- Mute
- Subscribe to RSS Feed
- Permalink
- Report Inappropriate Content
Set analysis
Hi,
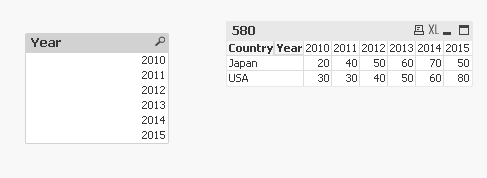
we are displaying 5 years of sales
2010 2011 2012 2013 2014 2015 Total
Japan 20 40 50 60 70 50
USA 30 30 40 50 60 80
Requirement:
1)when i select 2015 sales it should show only 2015 sales ant that total only other should display as zero
2)if no selections are there that should display 5 years sales
thanks
- « Previous Replies
-
- 1
- 2
- Next Replies »
- Mark as New
- Bookmark
- Subscribe
- Mute
- Subscribe to RSS Feed
- Permalink
- Report Inappropriate Content
It should be possible to show all dimensional values even when you select a specific one by enabling
'Show all Values' on Dimensions tab of chart properties.
- Mark as New
- Bookmark
- Subscribe
- Mute
- Subscribe to RSS Feed
- Permalink
- Report Inappropriate Content
Thanks for reply
ok but how to write set analysis expression eg.if i selected 2015 it showld only show 2015 .onlu current selectioniw would be help full if any sample application,thanks
- Mark as New
- Bookmark
- Subscribe
- Mute
- Subscribe to RSS Feed
- Permalink
- Report Inappropriate Content
Not sure if I understand. If you enable 'Show all Value' for year dimension and then select 2015, you should see all year dimension values (not reduced to 2015), but the expression should return the value only for 2015 and zero for all other years. I think this should fulfill your requirements:
Requirement:
1)when i select 2015 sales it should show only 2015 sales ant that total only other should display as zero
2)if no selections are there that should display 5 years sales
If it doesn't, please clarify your requirements and post some sample records or a sample QVW that demonstrate your setting.
- Mark as New
- Bookmark
- Subscribe
- Mute
- Subscribe to RSS Feed
- Permalink
- Report Inappropriate Content
May be a little different approach then Stefan's way, but seems to be working
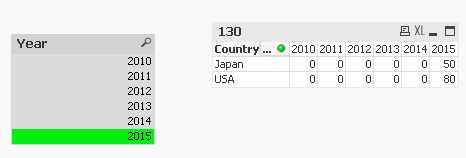
Expression: =If(Sum({1} Sales) > 0, Sum(Sales))
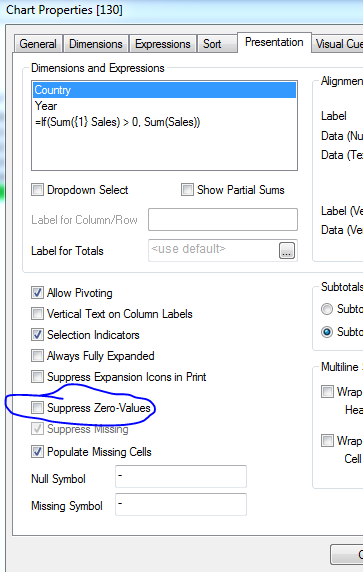
Make sure to uncheck 'Suppress Zero-Values' on the presentation tab.
- Mark as New
- Bookmark
- Subscribe
- Mute
- Subscribe to RSS Feed
- Permalink
- Report Inappropriate Content
hi sunny,
i my case i i wrote different expression for different year it's not working in my case
PFA
Thanks
- Mark as New
- Bookmark
- Subscribe
- Mute
- Subscribe to RSS Feed
- Permalink
- Report Inappropriate Content
If you are using different expressions, you can enable the conditional expression feature on expression tab and set a conditon to enable / disable each expression maybe like
=Sum({<Year *= {2015} >} 1)
as an example for the condition for the expression for year 2015.
edit:
Or since you want to show the columns all the time, but zero the expressions for excluded years:
Don't use the conditional expression, but change your set expression from
=Sum({<Year = {2015} >} Value)
to
=Sum({<Year *= {2015} >} Value)
Note again the intersection operator *
- Mark as New
- Bookmark
- Subscribe
- Mute
- Subscribe to RSS Feed
- Permalink
- Report Inappropriate Content
Do you have to use straight table? Pivot table is not an option? Check if the attached is helpful
- Mark as New
- Bookmark
- Subscribe
- Mute
- Subscribe to RSS Feed
- Permalink
- Report Inappropriate Content
thanks.
its working fine but small doubt
1)if my user want to see last 10 months of ofsales in straight or pivote table with total.
like if he selected Mar 16 month in filter. he should see March month sales else with out selection he want to see 10 month of sales like june 2015 mar 2015 (10 months of data in 10 columns)
in this senario is it work.
sorry for asking many Questions
- Mark as New
- Bookmark
- Subscribe
- Mute
- Subscribe to RSS Feed
- Permalink
- Report Inappropriate Content
I don't think your attached application have data for Mar 2016? Is there a better sample you can share?
- « Previous Replies
-
- 1
- 2
- Next Replies »