Unlock a world of possibilities! Login now and discover the exclusive benefits awaiting you.
- Qlik Community
- :
- All Forums
- :
- QlikView App Dev
- :
- Set analysis
- Subscribe to RSS Feed
- Mark Topic as New
- Mark Topic as Read
- Float this Topic for Current User
- Bookmark
- Subscribe
- Mute
- Printer Friendly Page
- Mark as New
- Bookmark
- Subscribe
- Mute
- Subscribe to RSS Feed
- Permalink
- Report Inappropriate Content
Set analysis
Hi All,
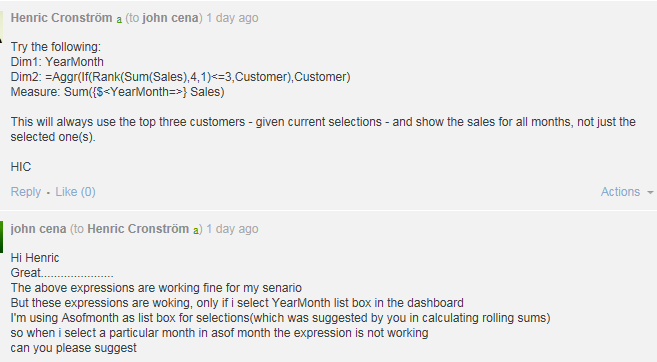
I have a set expression
Sum({$<MonthYear=>}sales)
now i want to add a flag to it MYflag ={'1'}
How can i add it
- Mark as New
- Bookmark
- Subscribe
- Mute
- Subscribe to RSS Feed
- Permalink
- Report Inappropriate Content
Sum({$<MonthYear=, MYflag ={'1'}>}sales)
talk is cheap, supply exceeds demand
- Mark as New
- Bookmark
- Subscribe
- Mute
- Subscribe to RSS Feed
- Permalink
- Report Inappropriate Content
Hi gysbert
when i'm giving the flag my chart is showing no data to disaplay
My problem started here
in the below thread can you please help me out
- Mark as New
- Bookmark
- Subscribe
- Mute
- Subscribe to RSS Feed
- Permalink
- Report Inappropriate Content
The problem in chart
when i'm selecting the Asof month i'm not getting the correct results
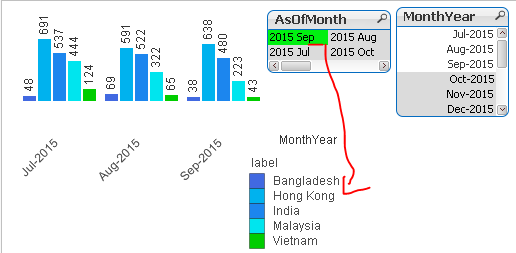
When i'm selecting the asof month and monthyear i'm getting the correct results
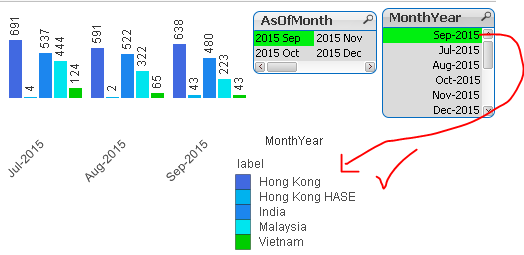
Below are the dimensions and expressions used
DIM1 Monthyear
DIM2 =Aggr(If(Rank(Sum(sales),4,1)<=5,country),country)
expression
Sum({$<MonthYear=>}sales)
- Mark as New
- Bookmark
- Subscribe
- Mute
- Subscribe to RSS Feed
- Permalink
- Report Inappropriate Content
Hi John,
Can you upload qvw?