Unlock a world of possibilities! Login now and discover the exclusive benefits awaiting you.
- Qlik Community
- :
- All Forums
- :
- QlikView App Dev
- :
- Set analysis?
- Subscribe to RSS Feed
- Mark Topic as New
- Mark Topic as Read
- Float this Topic for Current User
- Bookmark
- Subscribe
- Mute
- Printer Friendly Page
- Mark as New
- Bookmark
- Subscribe
- Mute
- Subscribe to RSS Feed
- Permalink
- Report Inappropriate Content
Set analysis?
Hi all!
In attached application I have three fields. DeviceId, TimeStamp and SensorId. Sensors that have names that starts with sensor-7 are in the sensorGroup “In”, others are in the sensorGroup “Out”.
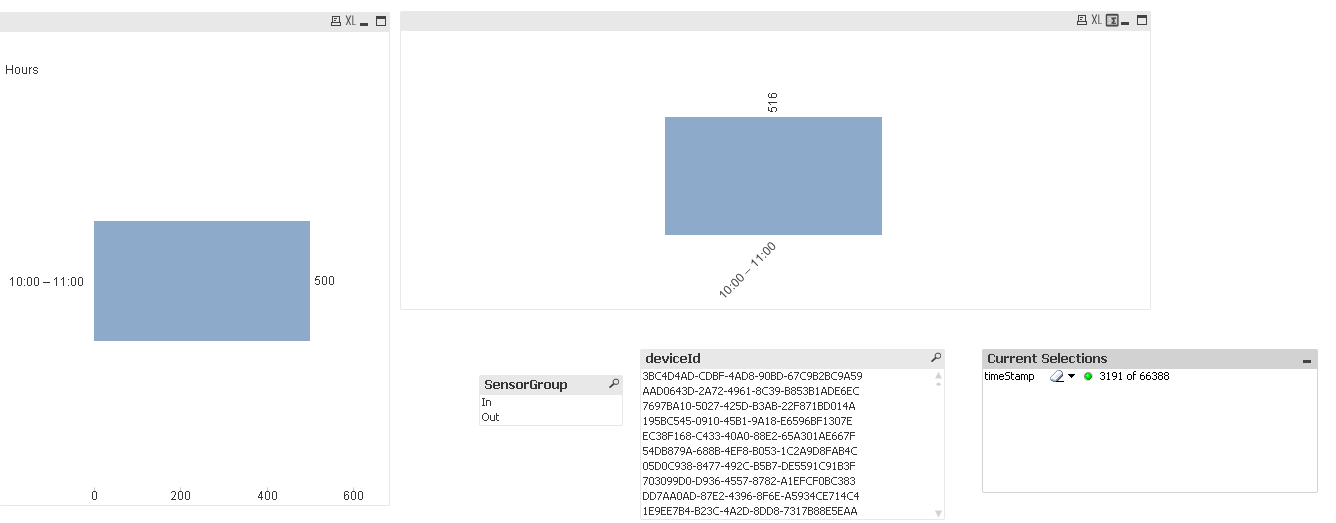
In the two charts I count deviceId’s for each hour (genereated from the TimeStamp). In the chart to the left I only have results from the “In” group and in the chart to the right I only have the results for the “Out” group.
What I want to do is when I click on one bar on the chart to the left, the other chart should only use the deviceId’s included for the bar to the right.
Probably easy for some Set analysis genius but I'm scratching my head 
- Tags:
- develop
- set_analisys
- Mark as New
- Bookmark
- Subscribe
- Mute
- Subscribe to RSS Feed
- Permalink
- Report Inappropriate Content
The expression on the right gives a count of the unique deviceids in the current selection state that also have a SensorGroup of 'Out' :
count({$<SensorGroup ={'Out'}>} DISTINCT deviceId)
When you click on a bar on the left , it is selecting a set of timestamp values which are associated to a set of deviceids . The set of deviceIds are shown in white in the list box.
I may be missing something, but i think you are getting what you asked for already... a list of deviceids that are in sensorgroup='out' for the time period selected.
for example, if you add 'deviceid' to bar on the right as a 2nd dimension you will notice only the deviceids in white in the list box are showing.
I know i'm probably missing something though ... ! please correct me
- Mark as New
- Bookmark
- Subscribe
- Mute
- Subscribe to RSS Feed
- Permalink
- Report Inappropriate Content
I think when we click on any one chart, the 2nd chart automatically reduced to the common DeviceID...
Can you check this at your end also and let me know if I am wrong..
- Mark as New
- Bookmark
- Subscribe
- Mute
- Subscribe to RSS Feed
- Permalink
- Report Inappropriate Content
You can imagine that all Devices that came in 10:00-11:00 went out again in different time. On the clip you attached I would like to see to the right the time when all this devices went out again.
- Mark as New
- Bookmark
- Subscribe
- Mute
- Subscribe to RSS Feed
- Permalink
- Report Inappropriate Content
Hi,
Well I'm not sure undersatand but I use a button to get an example of solution, add 3 Actions in the button:
1.- Select in Field - Field = SensorGroup - Search Straing = 'In'.
2.- Select Possible - Field = deviceId
3.- Clear Field- Field = SensorGroup
If you select a bar of left chart eg. 10:00 -11:00 you get 500 by SensorGroup In and 516 by SensorGroup Out but you need just deviceId's associated to selection in left chatrt (SensorGroup In) so click on button and you get 236 in rigth chart (Out).
If above is that you need you can replay 3 actions in a trigger in Document Properties|Triggers|Field Event Trigger|On Select and add past 3 actions.
See attached
Best regards.
- Mark as New
- Bookmark
- Subscribe
- Mute
- Subscribe to RSS Feed
- Permalink
- Report Inappropriate Content
This is almost what I want . If I click the button and then delete timeStamp from Current Selection then I get what I want. But I don't want button. just want to click on a bar on the chart to the left.
I'm trying to figure this out with Set Analysis and/or Indirect Set analysis.