Unlock a world of possibilities! Login now and discover the exclusive benefits awaiting you.
- Qlik Community
- :
- All Forums
- :
- QlikView App Dev
- :
- Set analysis
- Subscribe to RSS Feed
- Mark Topic as New
- Mark Topic as Read
- Float this Topic for Current User
- Bookmark
- Subscribe
- Mute
- Printer Friendly Page
- Mark as New
- Bookmark
- Subscribe
- Mute
- Subscribe to RSS Feed
- Permalink
- Report Inappropriate Content
Set analysis
Hi Community,
i'm using pivot table in which having a following expression for region it shows 100% which is correct.
but when i put branch_type dimension in it they too become 100% which is wrong.
Count({<param_name={'Temperature'},region_name={$(=Concat(DISTINCT chr(39)®ion_name&chr(39),','))},
param_value={'<=-1'}>}param_value)
/
Count({1<param_name={'Temperature'},region_name={$(=Concat(DISTINCT chr(39)®ion_name&chr(39),','))},
param_value={'<=-1'}>}param_value)
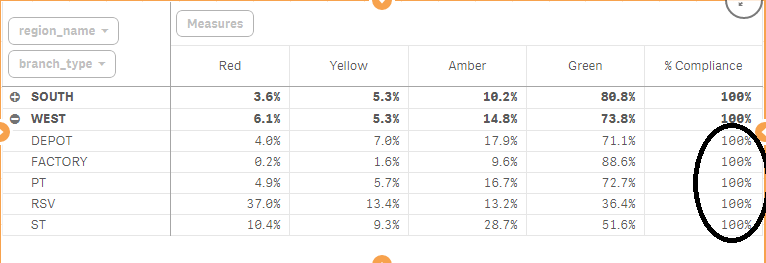
in above circle..the sum of percentage has to become 100% for WEST and same for SOUTH.
what changes needs to be done in set analysis ?
- Tags:
- new_to_qlikview
Accepted Solutions
- Mark as New
- Bookmark
- Subscribe
- Mute
- Subscribe to RSS Feed
- Permalink
- Report Inappropriate Content
Perhaps it should have been total <region_name>?
- Mark as New
- Bookmark
- Subscribe
- Mute
- Subscribe to RSS Feed
- Permalink
- Report Inappropriate Content
Try this one,
Count({<param_name={'Temperature'},region_name={$(=Concat(DISTINCT chr(39)®ion_name&chr(39),','))},
param_value={'<=-1'}>}param_value)
/
Count({1<param_name={'Temperature'},region_name={$(=Concat(DISTINCT chr(39)®ion_name&chr(39),','))},
param_value={'<=-1'}>} Total param_value)
Added total in expression.
- Mark as New
- Bookmark
- Subscribe
- Mute
- Subscribe to RSS Feed
- Permalink
- Report Inappropriate Content
Hi
In your expression,
Count({<param_name={'Temperature'},region_name={$(=Concat(DISTINCT chr(39)®ion_name&chr(39),','))},
param_value={'<=-1'}>}param_value)
/
Count({1<param_name={'Temperature'},region_name={$(=Concat(DISTINCT chr(39)®ion_name&chr(39),','))},
param_value={'<=-1'}>}param_value)
Both containst the same value. So its shows like 100%. If u select any values in any filters, than u can able to see the difference.
Try like this
Count({<param_name={'Temperature'},region_name={$(=Concat(DISTINCT chr(39)®ion_name&chr(39),','))},
param_value={'<=-1'}>}param_value)
/
Count({1<param_name={'Temperature'},region_name={$(=Concat(DISTINCT chr(39)®ion_name&chr(39),','))},
param_value={'<=-1'}>} TOTAL param_value)
Please close the thread by marking correct answer & give likes if you like the post.
- Mark as New
- Bookmark
- Subscribe
- Mute
- Subscribe to RSS Feed
- Permalink
- Report Inappropriate Content
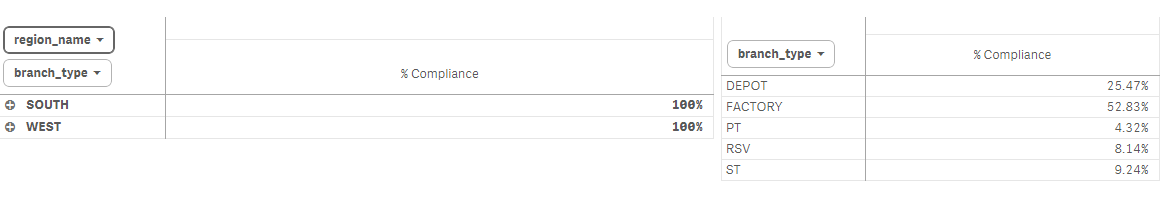
But can i put the only one formulae in PIVOT to show my required result.
here now i have both pivot table
- Mark as New
- Bookmark
- Subscribe
- Mute
- Subscribe to RSS Feed
- Permalink
- Report Inappropriate Content
You need a TOTAL qualifier in the divisor, not a '1':
Count({<param_name={'Temperature'}, param_value={'<=-1'}>} param_value)
/
Count({<param_name={'Temperature'}, param_value={'<=-1'}>} Total <branch_type> param_value)
The '1' ignores user selections, while the 'Total' ignores the dimensions in the table
- Mark as New
- Bookmark
- Subscribe
- Mute
- Subscribe to RSS Feed
- Permalink
- Report Inappropriate Content
But then it shows 100% for each branch_type..which is not correct
- Mark as New
- Bookmark
- Subscribe
- Mute
- Subscribe to RSS Feed
- Permalink
- Report Inappropriate Content
Perhaps it should have been total <region_name>?
- Mark as New
- Bookmark
- Subscribe
- Mute
- Subscribe to RSS Feed
- Permalink
- Report Inappropriate Content
actually my dilemma is to calculate
count all temperature which is less than -1 for region /
Count of all temperature which is less than -1 for region @--which is 100%
and
count all temperature which is less than -1 for XY branch_type /
Count of all temperature which is less than -1 for region in which XY branch_type locates
so that regions are 100% but branch_types percentage has to sum to 100%
can i have one formulae to workout this in pivot table where dimensions are branch_type and region_type ?
- Mark as New
- Bookmark
- Subscribe
- Mute
- Subscribe to RSS Feed
- Permalink
- Report Inappropriate Content
You can use dimensionality() function for your expression like,
If(Dimensionality()=1, Your Exp for Region, Your expression for Branch)
- Mark as New
- Bookmark
- Subscribe
- Mute
- Subscribe to RSS Feed
- Permalink
- Report Inappropriate Content
Count({<param_name={'Temperature'}, param_value={'<=-1'}>} param_value)
/
Count({<param_name={'Temperature'}, param_value={'<=-1'}>} Total <region_name> param_value)
can you explain please what it does actually-------Total <region_name> param_value)