Unlock a world of possibilities! Login now and discover the exclusive benefits awaiting you.
- Qlik Community
- :
- All Forums
- :
- QlikView App Dev
- :
- SetAnalysis with Fields range
- Subscribe to RSS Feed
- Mark Topic as New
- Mark Topic as Read
- Float this Topic for Current User
- Bookmark
- Subscribe
- Mute
- Printer Friendly Page
- Mark as New
- Bookmark
- Subscribe
- Mute
- Subscribe to RSS Feed
- Permalink
- Report Inappropriate Content
SetAnalysis with Fields range
Hi
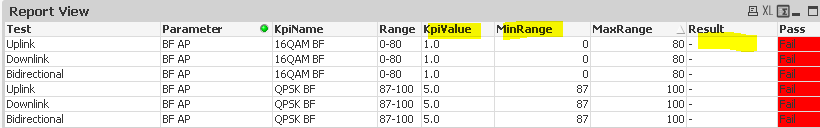
I need to calculate Result field which is AVG of AVG_VAL but its take only range between MinRange and MaxRange.
I try to wrote this:
Avg({<Attenuator = {'>=MinRange<=MaxRange' }>}AVG_Val)
But didn't get any result.
Any suggestions?
Thanks
Ravit.
Accepted Solutions
- Mark as New
- Bookmark
- Subscribe
- Mute
- Subscribe to RSS Feed
- Permalink
- Report Inappropriate Content
Oh okay, I got you... are they going to be used as a dimension in this chart? If they will be, then may be this
Avg(If(Attenuator >= MinRange and Attenuator <= MaxRange, AVG_Val))
- Mark as New
- Bookmark
- Subscribe
- Mute
- Subscribe to RSS Feed
- Permalink
- Report Inappropriate Content
Set analysis is evaluated once per chart, you may have to use Aggr() with if or just if statement here? Can you share if MinRange and MaxRange are expression or a hard-coded value?
- Mark as New
- Bookmark
- Subscribe
- Mute
- Subscribe to RSS Feed
- Permalink
- Report Inappropriate Content
Hi
MinRange and MaxRange are database fields. that can be dynamic and change each row.
- Mark as New
- Bookmark
- Subscribe
- Mute
- Subscribe to RSS Feed
- Permalink
- Report Inappropriate Content
Oh okay, I got you... are they going to be used as a dimension in this chart? If they will be, then may be this
Avg(If(Attenuator >= MinRange and Attenuator <= MaxRange, AVG_Val))
- Mark as New
- Bookmark
- Subscribe
- Mute
- Subscribe to RSS Feed
- Permalink
- Report Inappropriate Content
Thanks a lot!