Unlock a world of possibilities! Login now and discover the exclusive benefits awaiting you.
Announcements
April 13–15 - Dare to Unleash a New Professional You at Qlik Connect 2026: Register Now!
- Qlik Community
- :
- All Forums
- :
- QlikView App Dev
- :
- Setting Gauge Segments Using variables
Options
- Subscribe to RSS Feed
- Mark Topic as New
- Mark Topic as Read
- Float this Topic for Current User
- Bookmark
- Subscribe
- Mute
- Printer Friendly Page
Turn on suggestions
Auto-suggest helps you quickly narrow down your search results by suggesting possible matches as you type.
Showing results for
Not applicable
2014-04-24
10:06 AM
- Mark as New
- Bookmark
- Subscribe
- Mute
- Subscribe to RSS Feed
- Permalink
- Report Inappropriate Content
Setting Gauge Segments Using variables
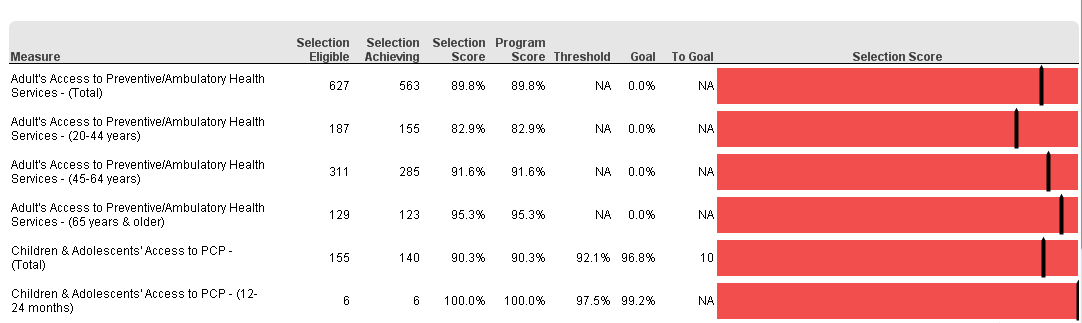
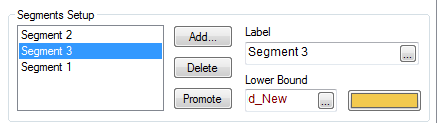
I am trying to add a gauge as a column in a table (image 1 below). I want the segment widths to be determined based on the MeasureID (which is a hidden dimension in my table). I have a variable for Threshold and another for Goal. The gauge should look like red up to Threshold, Yellow from Threshold to Goal, and Green above Goal. The issue is that the Lower Bound input doesn't seem to reference the Dimensions from the chart (image 2 below) so I need to figure out how to get that to work so it knows which Threshold and Goal to use for each row.
- Tags:
- linear_gauge
- segments
510 Views
1 Reply
Partner - Champion III
2014-04-24
10:16 AM
- Mark as New
- Bookmark
- Subscribe
- Mute
- Subscribe to RSS Feed
- Permalink
- Report Inappropriate Content
The segment boundaries cannot be set per row. These settings are applied at the chart level.
talk is cheap, supply exceeds demand
374 Views