Unlock a world of possibilities! Login now and discover the exclusive benefits awaiting you.
- Qlik Community
- :
- All Forums
- :
- QlikView App Dev
- :
- Sheet level restriction
- Subscribe to RSS Feed
- Mark Topic as New
- Mark Topic as Read
- Float this Topic for Current User
- Bookmark
- Subscribe
- Mute
- Printer Friendly Page
- Mark as New
- Bookmark
- Subscribe
- Mute
- Subscribe to RSS Feed
- Permalink
- Report Inappropriate Content
Sheet level restriction
Hi All,
I want to show only 57 ports data only in one sheet how can i do
i had tried to using triggers in sheet it is not that much effective
Thanks
sivaram
- « Previous Replies
-
- 1
- 2
- Next Replies »
- Mark as New
- Bookmark
- Subscribe
- Mute
- Subscribe to RSS Feed
- Permalink
- Report Inappropriate Content
In Script write those 57 Port in either if clause of where to clause.
Regards
Please appreciate our Qlik community members by giving Kudos for sharing their time for your query. If your query is answered, please mark the topic as resolved 🙂
- Mark as New
- Bookmark
- Subscribe
- Mute
- Subscribe to RSS Feed
- Permalink
- Report Inappropriate Content
Thanks Jagan
i am sharing the screen
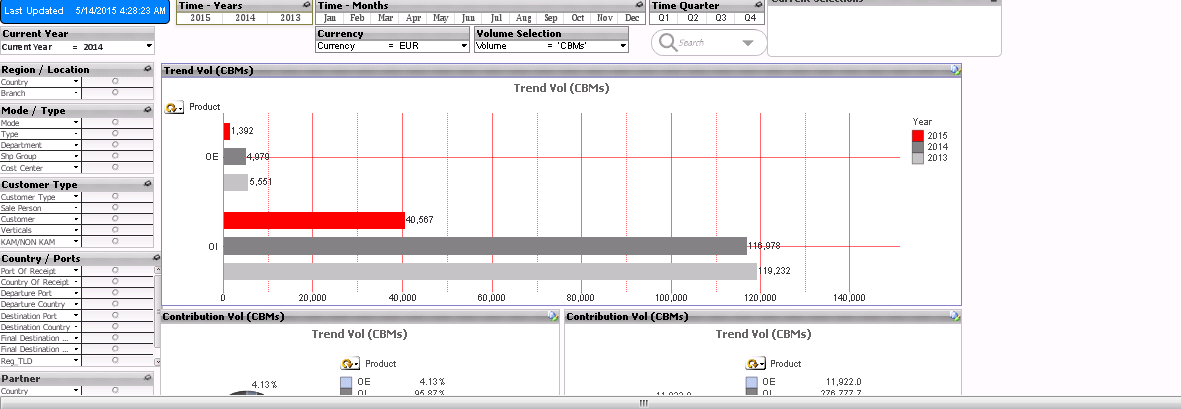
can u see the county/ports the multi boxs in that same multi boxs i have used in 10 sheets
in one sheet only i want to restrict
i have used trigger select in field that 57 ports result is good
but if clear in multi box it is going i had used lock field also can u plz help me
deporcher port
dest port
as u said to right a code in script if i have no opption left i will do that jagan i have to use in only one sheet only know why to right in script that what i think
Thanks once again
Sivaram
- Mark as New
- Bookmark
- Subscribe
- Mute
- Subscribe to RSS Feed
- Permalink
- Report Inappropriate Content
=aggr(if(rank(Expression),port of loading)),4)<=57,port of loading),port of loading)
=aggr(if(rank(Expression),port of depacher)),4)<=57,port of depacher),port of depacher)
Above expresion is base on Top 57 ports...
Try above expression..
Hope this helps you...
Regards,
Mohammad
- Mark as New
- Bookmark
- Subscribe
- Mute
- Subscribe to RSS Feed
- Permalink
- Report Inappropriate Content
Hi,
Handling this in script is a best option, if you select with trigger and then if you clear this selection will be gone. So my advice is try to handle that in script level.
Regards,
Jagan.
- Mark as New
- Bookmark
- Subscribe
- Mute
- Subscribe to RSS Feed
- Permalink
- Report Inappropriate Content
Also maintain this in Excel sheet, so that in future if you want to Add/Remove some ports changing the excel file is enough no need to touch Qlikview files. I always implement like this.
Regards,
Jagan.
- Mark as New
- Bookmark
- Subscribe
- Mute
- Subscribe to RSS Feed
- Permalink
- Report Inappropriate Content
Thanks
I will try with script only
but how can i show the values of this ports in charts using expression
but how in stight table
below are dimension
and exp
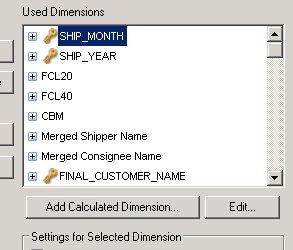
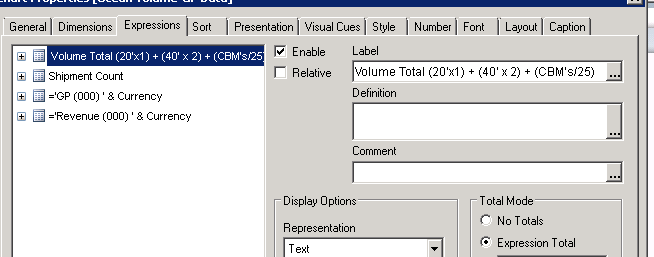
how can show the data for this ports only that stright table jagan
- Mark as New
- Bookmark
- Subscribe
- Mute
- Subscribe to RSS Feed
- Permalink
- Report Inappropriate Content
HI,
In all your expression put this condition in set analysis
=Sum({<Flag={1}>} MeasureName)
Regards,
Jagan.
- « Previous Replies
-
- 1
- 2
- Next Replies »