Unlock a world of possibilities! Login now and discover the exclusive benefits awaiting you.
- Qlik Community
- :
- All Forums
- :
- QlikView App Dev
- :
- Show 13 Months in Line Chart by Years
- Subscribe to RSS Feed
- Mark Topic as New
- Mark Topic as Read
- Float this Topic for Current User
- Bookmark
- Subscribe
- Mute
- Printer Friendly Page
- Mark as New
- Bookmark
- Subscribe
- Mute
- Subscribe to RSS Feed
- Permalink
- Report Inappropriate Content
Show 13 Months in Line Chart by Years
Hi, friends!
Any ideas - how to show that kind of diagramm.
It's like a challenge.
Waiting for any ideas, may be examples.
Thanks in advance.
Accepted Solutions
- Mark as New
- Bookmark
- Subscribe
- Mute
- Subscribe to RSS Feed
- Permalink
- Report Inappropriate Content
It can be achieved by creating the additional month with the right value in your data model:
![2017-09-09 16_57_24-Edit Script [C__Users_Petter_Documents_13 months plot.qvw].png](/legacyfs/online/176008_2017-09-09 16_57_24-Edit Script [C__Users_Petter_Documents_13 months plot.qvw].png)
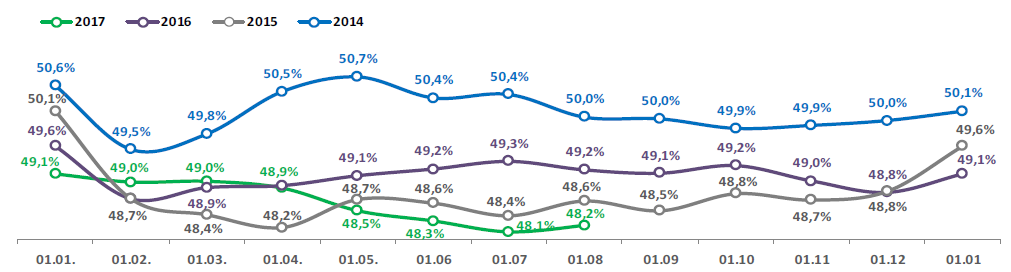
And a straightforward line chart would look like this:
![2017-09-09 16_56_46-QlikView x64 - [C__Users_Petter_Documents_13 months plot.qvw].png](/legacyfs/online/176009_2017-09-09 16_56_46-QlikView x64 - [C__Users_Petter_Documents_13 months plot.qvw].png)
The downside is that you have to be careful to exclude the 13th month in all other calculations or you will get incorrect results. That can be achieved with Set Expressions (Set Analysis).
- Mark as New
- Bookmark
- Subscribe
- Mute
- Subscribe to RSS Feed
- Permalink
- Report Inappropriate Content

- Mark as New
- Bookmark
- Subscribe
- Mute
- Subscribe to RSS Feed
- Permalink
- Report Inappropriate Content
It can be achieved by creating the additional month with the right value in your data model:
And a straightforward line chart would look like this:
The downside is that you have to be careful to exclude the 13th month in all other calculations or you will get incorrect results. That can be achieved with Set Expressions (Set Analysis).
- Mark as New
- Bookmark
- Subscribe
- Mute
- Subscribe to RSS Feed
- Permalink
- Report Inappropriate Content
Thanks a lot Petter 