Unlock a world of possibilities! Login now and discover the exclusive benefits awaiting you.
- Qlik Community
- :
- All Forums
- :
- QlikView App Dev
- :
- Show only some data in graph
- Subscribe to RSS Feed
- Mark Topic as New
- Mark Topic as Read
- Float this Topic for Current User
- Bookmark
- Subscribe
- Mute
- Printer Friendly Page
- Mark as New
- Bookmark
- Subscribe
- Mute
- Subscribe to RSS Feed
- Permalink
- Report Inappropriate Content
Show only some data in graph
Hi,
I have a graph with:
- dimension : Person
- espression: SUM(measuse)
I want to show in my table only Person that have SUM(measure) over a certain amout.
You know how to do that? 
thank u!
- Tags:
- new_to_qlikview
- « Previous Replies
-
- 1
- 2
- Next Replies »
- Mark as New
- Bookmark
- Subscribe
- Mute
- Subscribe to RSS Feed
- Permalink
- Report Inappropriate Content
Hi,
In addition to this is Dimension Limits tab controls the number of dimension values in your chart. And it depends on the option that you selected and according to that it produces the result. The dropdown contains three values: First, Largest and Smallest. These values control the way the calculation is completed and representing your chart. It is compulsary that you select one of this option.
Hope this helps
Thanks & Regards
- Mark as New
- Bookmark
- Subscribe
- Mute
- Subscribe to RSS Feed
- Permalink
- Report Inappropriate Content
Sorry but I can't undersand, for example, if I want only person with SUM(measure)>1000, what should I write in the tab "Dimension Limit"?
- Mark as New
- Bookmark
- Subscribe
- Mute
- Subscribe to RSS Feed
- Permalink
- Report Inappropriate Content
It works thank u!
- Mark as New
- Bookmark
- Subscribe
- Mute
- Subscribe to RSS Feed
- Permalink
- Report Inappropriate Content
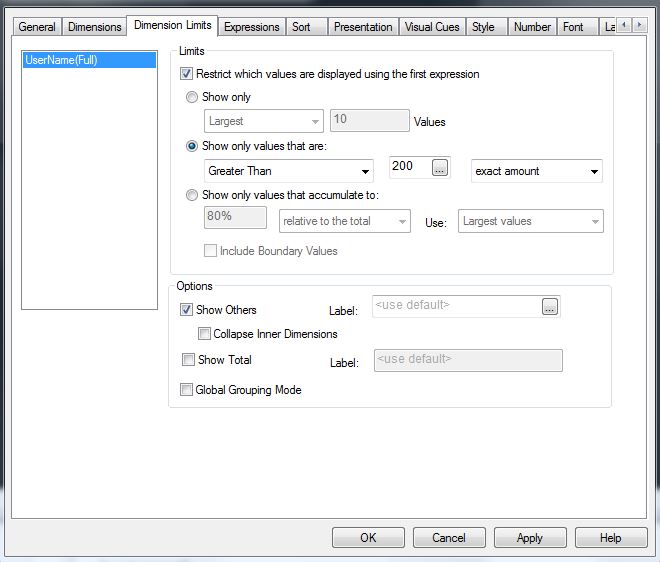
Tick the box "Restrict which values are shown using the first expression"
Select
"Show only values that are" "Greater Than" enter the limit value, say 200
then select
"exact amount"
- Mark as New
- Bookmark
- Subscribe
- Mute
- Subscribe to RSS Feed
- Permalink
- Report Inappropriate Content
Thank u very much!
- Mark as New
- Bookmark
- Subscribe
- Mute
- Subscribe to RSS Feed
- Permalink
- Report Inappropriate Content
excuse me again 'cause now I have a new question (if it's not good here I can open another Discussion but maybe you know the answer).
I thought that "dimesion limit" evaluetes the value of dimension and not the first measure. So, now, what can I do for really limit the value of "dimension"? For examle, same of before:
- dimension : Person
- expression: SUM(measuse)
how can I have a table with only the top 5 person in alphabetical order?
thank u!
- « Previous Replies
-
- 1
- 2
- Next Replies »