Unlock a world of possibilities! Login now and discover the exclusive benefits awaiting you.
- Qlik Community
- :
- All Forums
- :
- QlikView App Dev
- :
- Show text on top of each bar chart
- Subscribe to RSS Feed
- Mark Topic as New
- Mark Topic as Read
- Float this Topic for Current User
- Bookmark
- Subscribe
- Mute
- Printer Friendly Page
- Mark as New
- Bookmark
- Subscribe
- Mute
- Subscribe to RSS Feed
- Permalink
- Report Inappropriate Content
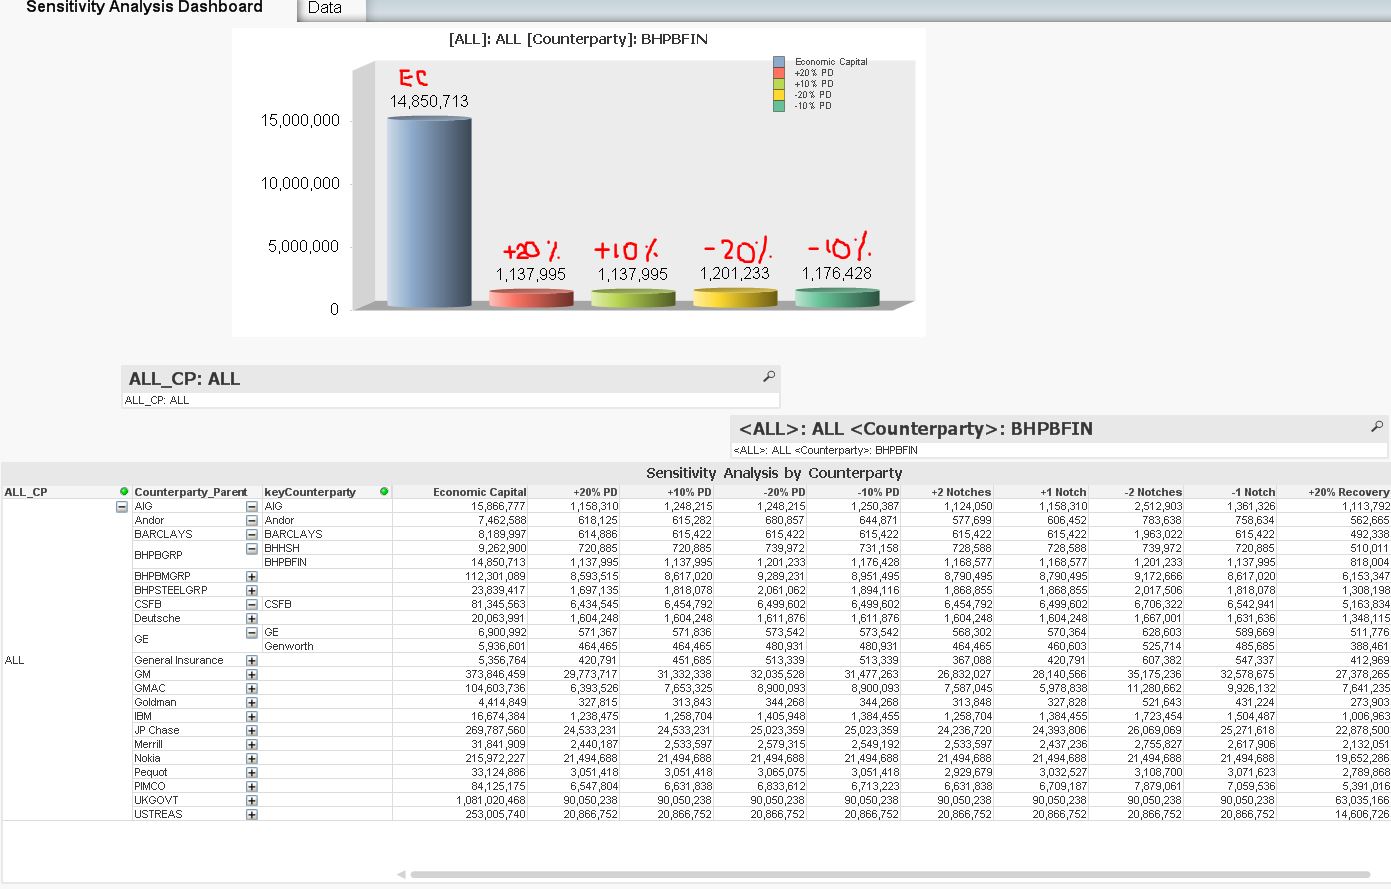
Show text on top of each bar chart
Hi,
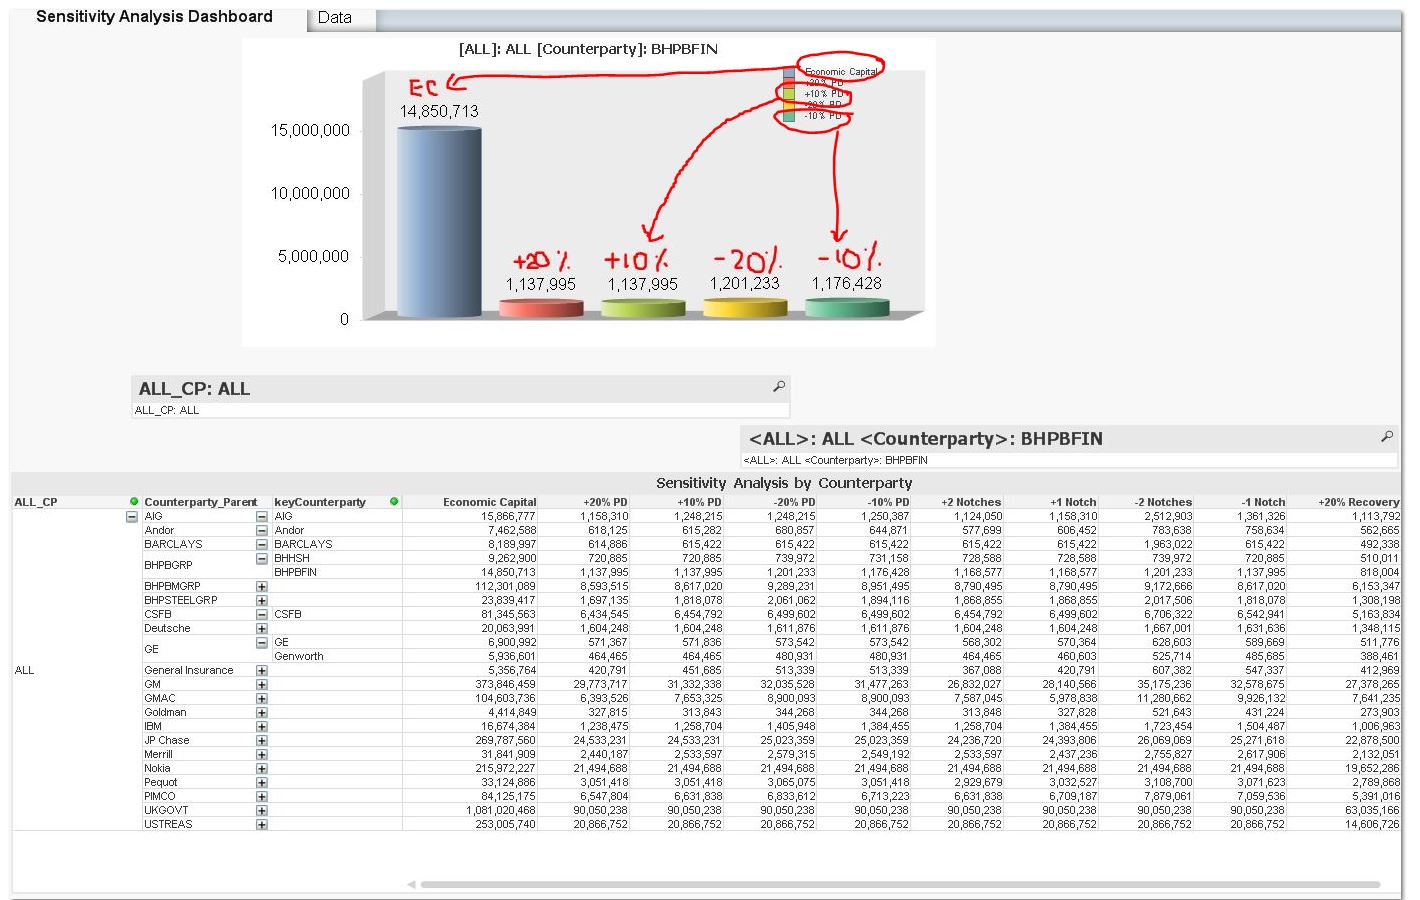
How do I configure to have text as indicate in the following snapshot to show on each bar chart. The position of the text should be able to move up or down dynamically according to the chart.
- Tags:
- new_to_qlikview
- Mark as New
- Bookmark
- Subscribe
- Mute
- Subscribe to RSS Feed
- Permalink
- Report Inappropriate Content
Do you want to show the percentages on the top of every bar or the exact amount or both?
- Mark as New
- Bookmark
- Subscribe
- Mute
- Subscribe to RSS Feed
- Permalink
- Report Inappropriate Content
1) If you want to show the amounts n top of the bar then you can go into properties of the bar chart and then go into expressions and check the box 'Values on Data Point'
2) If you want to show only the percentages then you can follo the same above mentioned procedure and also check the box 'Relative'.
If you want both to happen at same time then g owith the option (1) and after that make text objects displaying the percentages of the bar chart values and you can place them on the top of the bars. but it's not a good way to go.
- Mark as New
- Bookmark
- Subscribe
- Mute
- Subscribe to RSS Feed
- Permalink
- Report Inappropriate Content
I want to show the text of its legend.
- Mark as New
- Bookmark
- Subscribe
- Mute
- Subscribe to RSS Feed
- Permalink
- Report Inappropriate Content
Hi,
you can use dual function to achieve the same
=DUAL( Only(A) & '-' & SUM(A), SUM(B))
- Mark as New
- Bookmark
- Subscribe
- Mute
- Subscribe to RSS Feed
- Permalink
- Report Inappropriate Content
You could put the percentage expression in an additionally bar and hide these bar.
- Marcus