Unlock a world of possibilities! Login now and discover the exclusive benefits awaiting you.
- Qlik Community
- :
- All Forums
- :
- QlikView App Dev
- :
- Showing Specific Dates on a Line Chart with Contin...
- Subscribe to RSS Feed
- Mark Topic as New
- Mark Topic as Read
- Float this Topic for Current User
- Bookmark
- Subscribe
- Mute
- Printer Friendly Page
- Mark as New
- Bookmark
- Subscribe
- Mute
- Subscribe to RSS Feed
- Permalink
- Report Inappropriate Content
Showing Specific Dates on a Line Chart with Continuous Axis
I have a chart where I want a data point for every day of the year and have all data points be visible without scrolling. I know I'm supposed to check the box for continuous in the Axis tab, but when I do this, the chart shows the label for the first day of each month.
How can I get it to show the label for the last day of the month (while still plotting the points for all days in between)?
- « Previous Replies
-
- 1
- 2
- Next Replies »
- Mark as New
- Bookmark
- Subscribe
- Mute
- Subscribe to RSS Feed
- Permalink
- Report Inappropriate Content
Can you share a sample file to look into?
- Mark as New
- Bookmark
- Subscribe
- Mute
- Subscribe to RSS Feed
- Permalink
- Report Inappropriate Content
Document is attached. You'll see that the x axis labels show month / first day. I'd like for it to show the table for the last day instead.
- Mark as New
- Bookmark
- Subscribe
- Mute
- Subscribe to RSS Feed
- Permalink
- Report Inappropriate Content
May be try this?
ARC:
LOAD
Month(SSDate) as M
, Day(SSDate) as D
, Day(MonthEnd(SSDATE)) AS MED
, FacNumber
, GrossPotential as CYGPI
, SqFtOccpy as CYSFO
RESIDENT Step2
WHERE Year(SSDate) = $(vCurrentYear)
;
JOIN (ARC)
LOAD
Month(SSDate) as M
, Day(SSDate) as D
, Day(MonthEnd(SSDATE)) AS MED
, FacNumber
, GrossPotential as PYGPI
, SqFtOccpy as PYSFO
RESIDENT Step2
WHERE Year(SSDate) = $(vPriorYear)
;
DROP TABLE Step2;
Then use MED in your Chart instead of D.
- Mark as New
- Bookmark
- Subscribe
- Mute
- Subscribe to RSS Feed
- Permalink
- Report Inappropriate Content
Oh ok, i got it now. Can you also Load your SSDATE in your QV document cos we need to use some MonthEnd and MonthStart functions on that date. Update Like mentioned above:
ARC:
LOAD
Month(SSDate) as M
, Day(SSDate) as D
, Day(MonthEnd(SSDATE)) AS MED
, SSDATE
, FacNumber
, GrossPotential as CYGPI
, SqFtOccpy as CYSFO
RESIDENT Step2
WHERE Year(SSDate) = $(vCurrentYear)
;
JOIN (ARC)
LOAD
Month(SSDate) as M
, Day(SSDate) as D
, Day(MonthEnd(SSDATE)) AS MED
, SSDATE
, FacNumber
, GrossPotential as PYGPI
, SqFtOccpy as PYSFO
RESIDENT Step2
WHERE Year(SSDate) = $(vPriorYear)
;
DROP TABLE Step2;
Once you run adding these fields, please upload the latest sample.
- Mark as New
- Bookmark
- Subscribe
- Mute
- Subscribe to RSS Feed
- Permalink
- Report Inappropriate Content
Data attached with Med and SSDate. There's an issue with the month end column for Feburary due to 2016 being a leap year. Month end for that year is 29 while this year is 28, so the results created duplicates.
- Mark as New
- Bookmark
- Subscribe
- Mute
- Subscribe to RSS Feed
- Permalink
- Report Inappropriate Content
Vishwarath, any updates on this? I still have been unable to show the end of month label on my charts.
- Mark as New
- Bookmark
- Subscribe
- Mute
- Subscribe to RSS Feed
- Permalink
- Report Inappropriate Content
I am very sorry, it got completely skipped out of my brains. I am not sure what exactly we are looking here. Can you explain it again please. Sorry was preoccupied with other stuff and completely forgot about what we are looking in this.
- Mark as New
- Bookmark
- Subscribe
- Mute
- Subscribe to RSS Feed
- Permalink
- Report Inappropriate Content
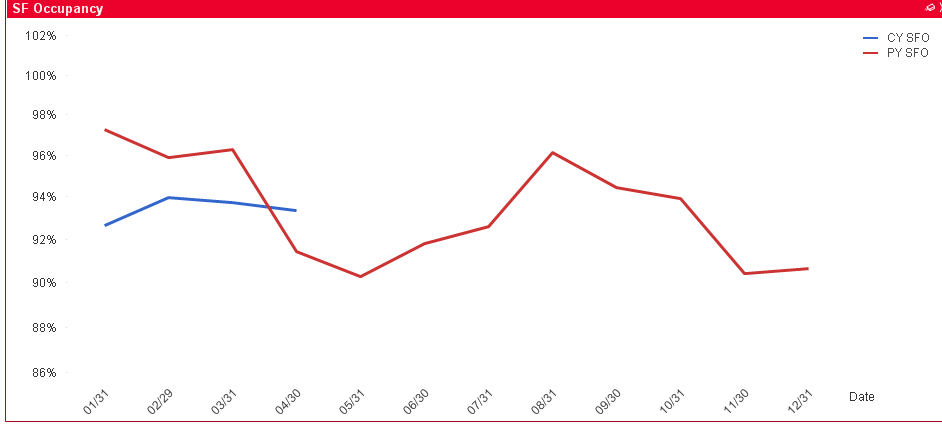
No problem.
I have a line chart that maps a data point for every day in a year. I'm able to show all of the data points on the chart by selecting the Continuous checkbox on the Axis tab. I want the x-axis (which shows the date label) to only show a label for the end of the month. However, it looks like Qlikview dynamically determines what dates it will show depending on the amount of space available.
If the chart size is small, QlikView picks the first day of the month (1/1, 2/1,. 3/1). If the chart size is larger, it will show the first day and the 15th day (1/1, 1/15, 2/1, 2/15, 3/1, 3/15). I ONLY want the labels for the end of the month to show (1/31, 2/28/, 3/31).
- Mark as New
- Bookmark
- Subscribe
- Mute
- Subscribe to RSS Feed
- Permalink
- Report Inappropriate Content
OK, i am not sure if this is what you are looking for? let me know.
- « Previous Replies
-
- 1
- 2
- Next Replies »