Unlock a world of possibilities! Login now and discover the exclusive benefits awaiting you.
- Qlik Community
- :
- All Forums
- :
- QlikView App Dev
- :
- Showing revenue depending on 2 different date-fiel...
- Subscribe to RSS Feed
- Mark Topic as New
- Mark Topic as Read
- Float this Topic for Current User
- Bookmark
- Subscribe
- Mute
- Printer Friendly Page
- Mark as New
- Bookmark
- Subscribe
- Mute
- Subscribe to RSS Feed
- Permalink
- Report Inappropriate Content
Showing revenue depending on 2 different date-fields in a bar chart
Hello community
This is my table
| order_id | order_date | delivery_date | revenue |
|---|---|---|---|
| 1001 | 20.01.2018 | 21.01.2018 | 100 |
| 1002 | 20.01.2018 | 21.01.2018 | 100 |
| 1003 | 27.01.2018 | 29.01.2018 | 200 |
| 1004 | 27.01.2018 | 29.01.2018 | 200 |
| 1005 | 31.01.2018 | 01.02.2018 | 300 |
| 1006 | 31.01.2018 | 01.02.2018 | 300 |
| 1007 | 25.02.2018 | 27.02.2018 | 100 |
| 1008 | 26.02.2018 | 28.02.2018 | 100 |
| 1009 | 28.02.2018 | 01.03.2018 | 200 |
| 1010 | 15.03.2018 | 15.03.2018 | 500 |
| 1011 | 30.03.2018 | 31.03.2018 | 200 |
| 1012 | 31.03.2018 | 01.04.2018 | 100 |
Target:
Showing revenue per month with delivery_date considering the order_date in a bar chart
Dimension:
order_date (Main dimension)
delivery_date
KPI:
sum(revenue)
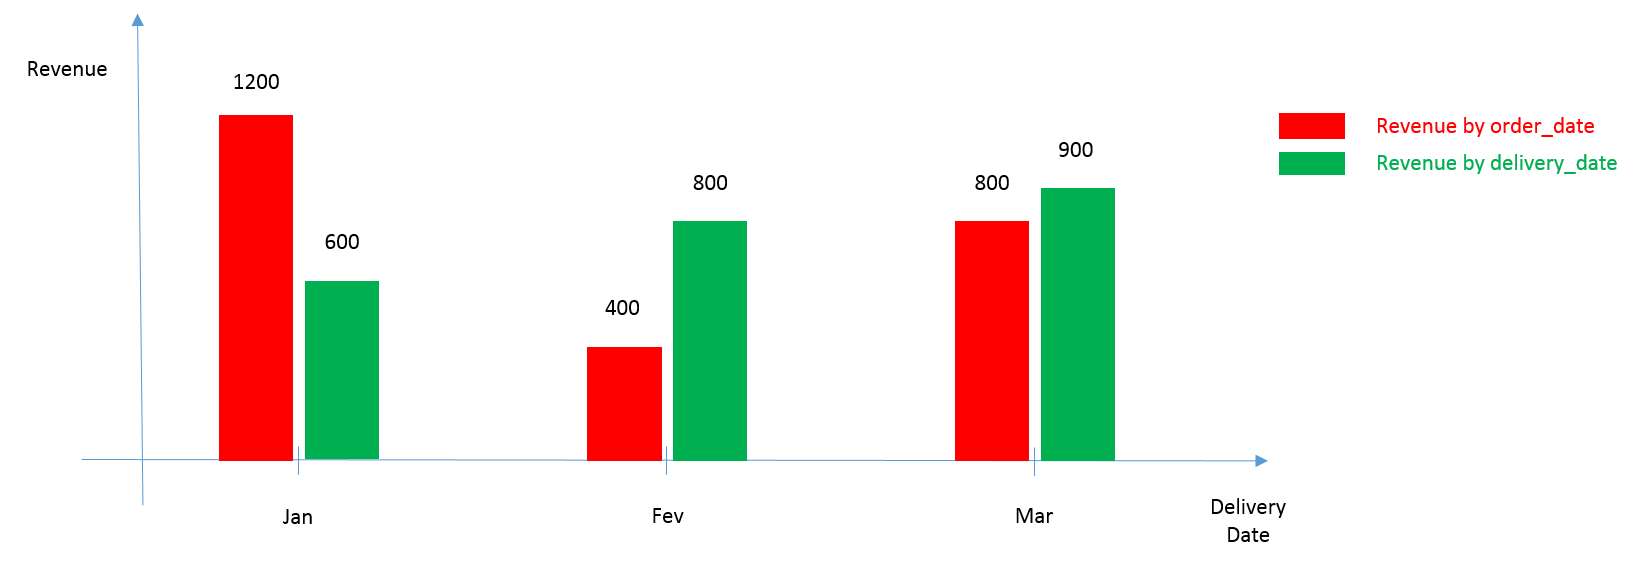
How it should be calculated:
| Jan | Fev | Mar | ||
|---|---|---|---|---|
| Revenue by order_date | 1200 | 400 | 800 | |
| revenue by delivery_date | 600 | 800 | 900 |
How it should look like at the end (ignoring avril). The main dimension is delivery_date:
Hope anyone can really understand what I'm trying to say.
- « Previous Replies
-
- 1
- 2
- Next Replies »
- Mark as New
- Bookmark
- Subscribe
- Mute
- Subscribe to RSS Feed
- Permalink
- Report Inappropriate Content
AFAIK may be not... but even it was... it would be a horrible looking and horrible performing expression...
- Mark as New
- Bookmark
- Subscribe
- Mute
- Subscribe to RSS Feed
- Permalink
- Report Inappropriate Content
I see.. Good to know
- Mark as New
- Bookmark
- Subscribe
- Mute
- Subscribe to RSS Feed
- Permalink
- Report Inappropriate Content
Thank guys,
I tried with the bridge and it work very good for this data sample. Maybe another question. I have a big data here. About 1 billion datas. The current load take about 2 hours. With the concatenate load the loading process will take more time I guess no?
- Mark as New
- Bookmark
- Subscribe
- Mute
- Subscribe to RSS Feed
- Permalink
- Report Inappropriate Content
Unfortunately it will... not sure what other option do you have...
- Mark as New
- Bookmark
- Subscribe
- Mute
- Subscribe to RSS Feed
- Permalink
- Report Inappropriate Content
Ok, thanks a lot for your help guys!
- « Previous Replies
-
- 1
- 2
- Next Replies »