Unlock a world of possibilities! Login now and discover the exclusive benefits awaiting you.
- Qlik Community
- :
- All Forums
- :
- QlikView App Dev
- :
- Simple chart with different variations
- Subscribe to RSS Feed
- Mark Topic as New
- Mark Topic as Read
- Float this Topic for Current User
- Bookmark
- Subscribe
- Mute
- Printer Friendly Page
- Mark as New
- Bookmark
- Subscribe
- Mute
- Subscribe to RSS Feed
- Permalink
- Report Inappropriate Content
Simple chart with different variations
Hi,
I need to produce 2 line charts with the small variation.
First Line chart : on the x axis i want the dimension Time for the last 6 months and y axis i want the browser only chrome,firefox and IE to display over the time.
Second chart : on the x axis I want the dimension Time for the last 6 months and Y axis I want only the IE Browser with different versions.
Can any one help pls. its urgent.
regards,
Vamsi.
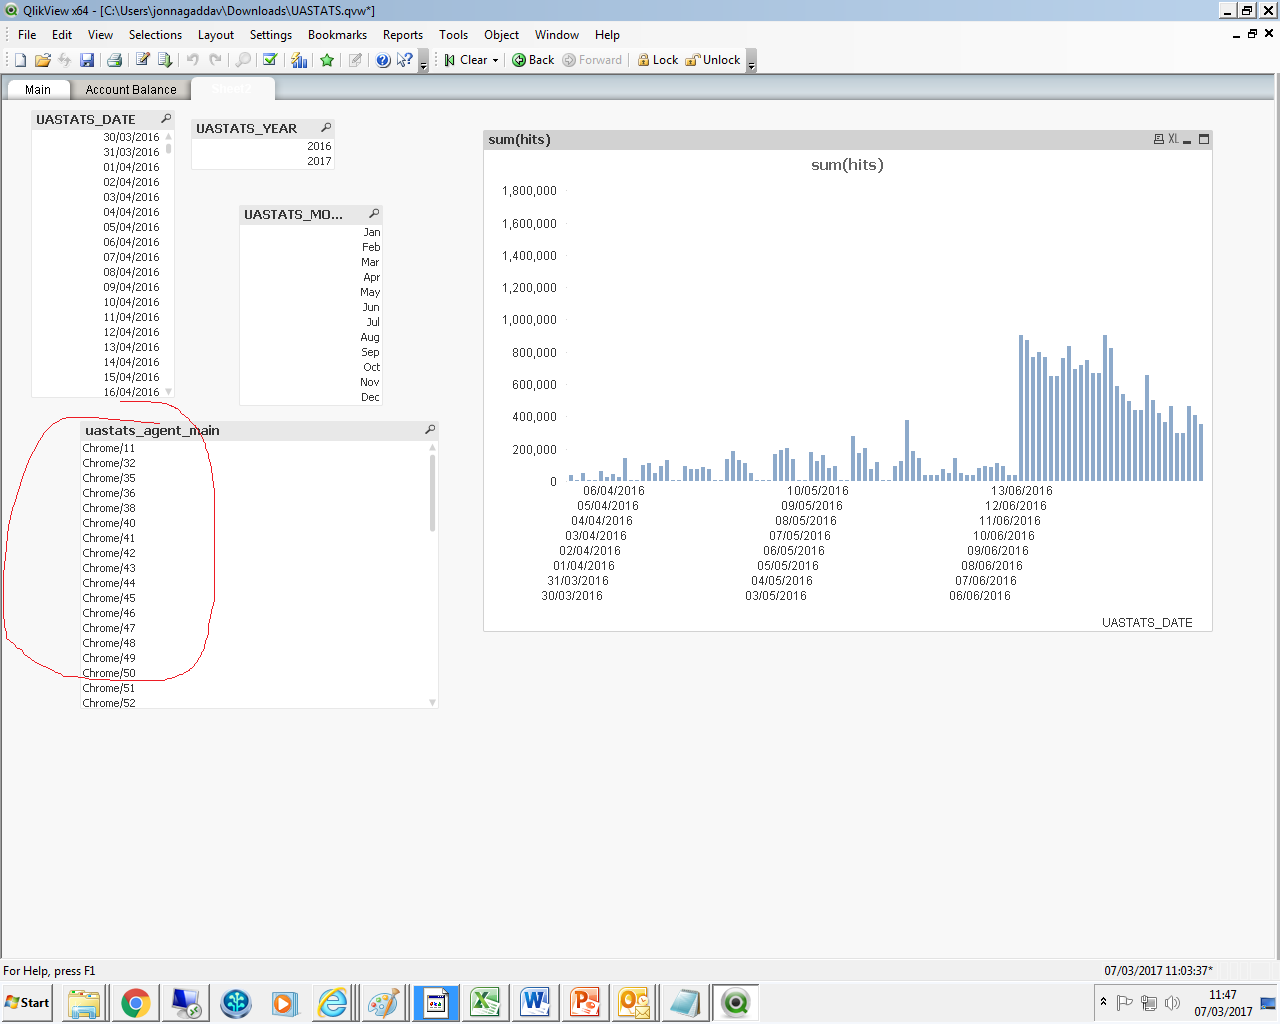
Note: How can I filter the Browser agents to show only Chrome, Firefox and IE in the first chart
How can I filter the Browser agents to show only IE ones in the second chart.
- Mark as New
- Bookmark
- Subscribe
- Mute
- Subscribe to RSS Feed
- Permalink
- Report Inappropriate Content
Hi,
Can you send me sample qvw?
- Mark as New
- Bookmark
- Subscribe
- Mute
- Subscribe to RSS Feed
- Permalink
- Report Inappropriate Content
Use Set analysis. So your expressions will be something like;
sum({<uastats_agent_main={'Chrome*','Firefox*','IE*'}>}hits)
for all three (note wild card * to allow for variations such as /01 or /02 etc)
and
sum({<uastats_agent_main={'IE*'}>}hits)
for just IE
- Mark as New
- Bookmark
- Subscribe
- Mute
- Subscribe to RSS Feed
- Permalink
- Report Inappropriate Content
Thank you.