Unlock a world of possibilities! Login now and discover the exclusive benefits awaiting you.
- Qlik Community
- :
- All Forums
- :
- QlikView App Dev
- :
- Something New! anyone created Risk Inter dependenc...
- Subscribe to RSS Feed
- Mark Topic as New
- Mark Topic as Read
- Float this Topic for Current User
- Bookmark
- Subscribe
- Mute
- Printer Friendly Page
- Mark as New
- Bookmark
- Subscribe
- Mute
- Subscribe to RSS Feed
- Permalink
- Report Inappropriate Content
Something New! anyone created Risk Inter dependencies mapping visual object ?
Hi guys,
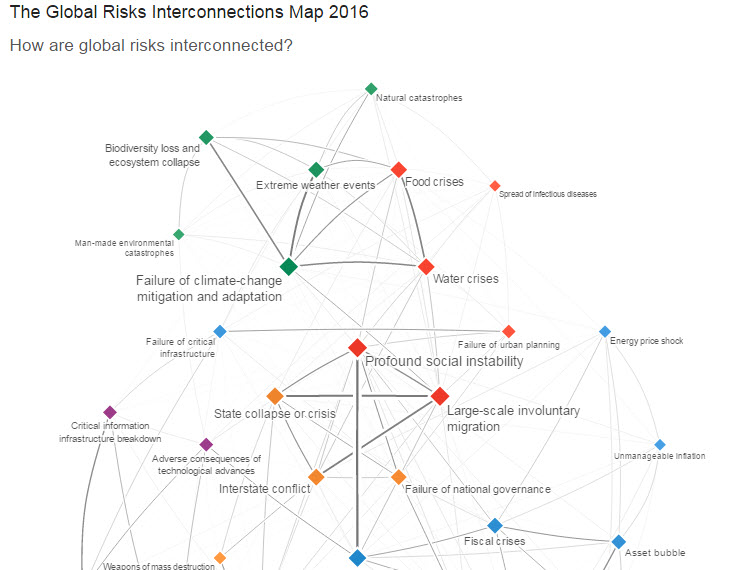
My client has proposed a visual on - Risk Interdependencies Mapping, as below.
I have no idea on how to show the risk interconnections. and ....qlikview doesnt have this kind of chart rite?
Is there alternatives u guys can think of ??
I think.. create a scatter chart, display which one has the most number of risks. Then created another pivot table to show the inter connected risk.
Rgds,
Jim
- Mark as New
- Bookmark
- Subscribe
- Mute
- Subscribe to RSS Feed
- Permalink
- Report Inappropriate Content
Jim,
No direct object from qlikview to do this. Probably extensions. refer some links below
Working with Graph Data from Neo4j
Re: Visualization of Graph Data
New Qlikview Chart Type: Dynamic Network Flow Charts | QVDesign
- Mark as New
- Bookmark
- Subscribe
- Mute
- Subscribe to RSS Feed
- Permalink
- Report Inappropriate Content
Download it from here Qlik Branch
- Mark as New
- Bookmark
- Subscribe
- Mute
- Subscribe to RSS Feed
- Permalink
- Report Inappropriate Content
By the way, do you have any advise you can share with me on this?
how to create this advance radar chart?
Rgds,
Jim