Unlock a world of possibilities! Login now and discover the exclusive benefits awaiting you.
- Qlik Community
- :
- All Forums
- :
- QlikView App Dev
- :
- Sorting Data - First sorted value - Pulling corres...
- Subscribe to RSS Feed
- Mark Topic as New
- Mark Topic as Read
- Float this Topic for Current User
- Bookmark
- Subscribe
- Mute
- Printer Friendly Page
- Mark as New
- Bookmark
- Subscribe
- Mute
- Subscribe to RSS Feed
- Permalink
- Report Inappropriate Content
Sorting Data - First sorted value - Pulling corresponding Text Field
Hi
I am struggling putting together a summary table for the Base set of data below.
| Year | Team | Count |
|---|---|---|
| 2011 | A | 5 |
| 2011 | B | 6 |
| 2011 | C | 4 |
| 2011 | D | 9 |
| 2012 | A | 8 |
| 2012 | B | 2 |
| 2012 | C | 4 |
| 2012 | D | 5 |
I want the summary table to look like the one below.
| Year | Team | Count |
|---|---|---|
| 2011 | C | 4 |
| 2012 | B | 2 |
The table displays the Min count per year and the corresponding teams to that min count. The part i am struggling with is pulling though the corresponding teams. I have tried first sorted value but that doesn't seem to work I need a formula that pulls through the Team
Thanks for your help
- « Previous Replies
-
- 1
- 2
- Next Replies »
- Mark as New
- Bookmark
- Subscribe
- Mute
- Subscribe to RSS Feed
- Permalink
- Report Inappropriate Content
Here you are my script:
// ***** Data Source ***************************
Data:
LOAD * INLINE [
Year, Team, Count
2011, A, 5
2011, B, 6
2011, C, 4
2011, D, 9
2012, A, 8
2012, B, 2
2012, C, 4
2012, D, 5
];
/*
Sort:
load
Year,
Team,
max(Count)
Resident Data Group By Year, Team;
*/
Sort:
load
Year,
min(Count) as Count
Resident Data
group by Year;
left Join
LOAD
Year,
Count,
Team
Resident Data;
drop table Data;
Hope it will help you
- Mark as New
- Bookmark
- Subscribe
- Mute
- Subscribe to RSS Feed
- Permalink
- Report Inappropriate Content
hi,
the following will help u for sure...
PFA
- Mark as New
- Bookmark
- Subscribe
- Mute
- Subscribe to RSS Feed
- Permalink
- Report Inappropriate Content
Assuming the data is loaded using the script
Data:
LOAD * INLINE [
Year, Team, Count
2011, A, 5
2011, B, 6
2011, C, 4
2011, D, 9
2012, A, 8
2012, B, 2
2012, C, 4
2012, D, 5
];
define the properties of the Summary table as below:
Dimension: Year
Expression 1 (for Team column) : FirstSortedValue(Team,Count)
Expression 2 (for Count column): FirstSortedValue(Count,Count)
With the above properties, the summary table will respond to the selections in the Data table fields.
- Mark as New
- Bookmark
- Subscribe
- Mute
- Subscribe to RSS Feed
- Permalink
- Report Inappropriate Content
I tried this script and somehow it is not working. Here is a screenshot. FirstOrderValue always return null for me.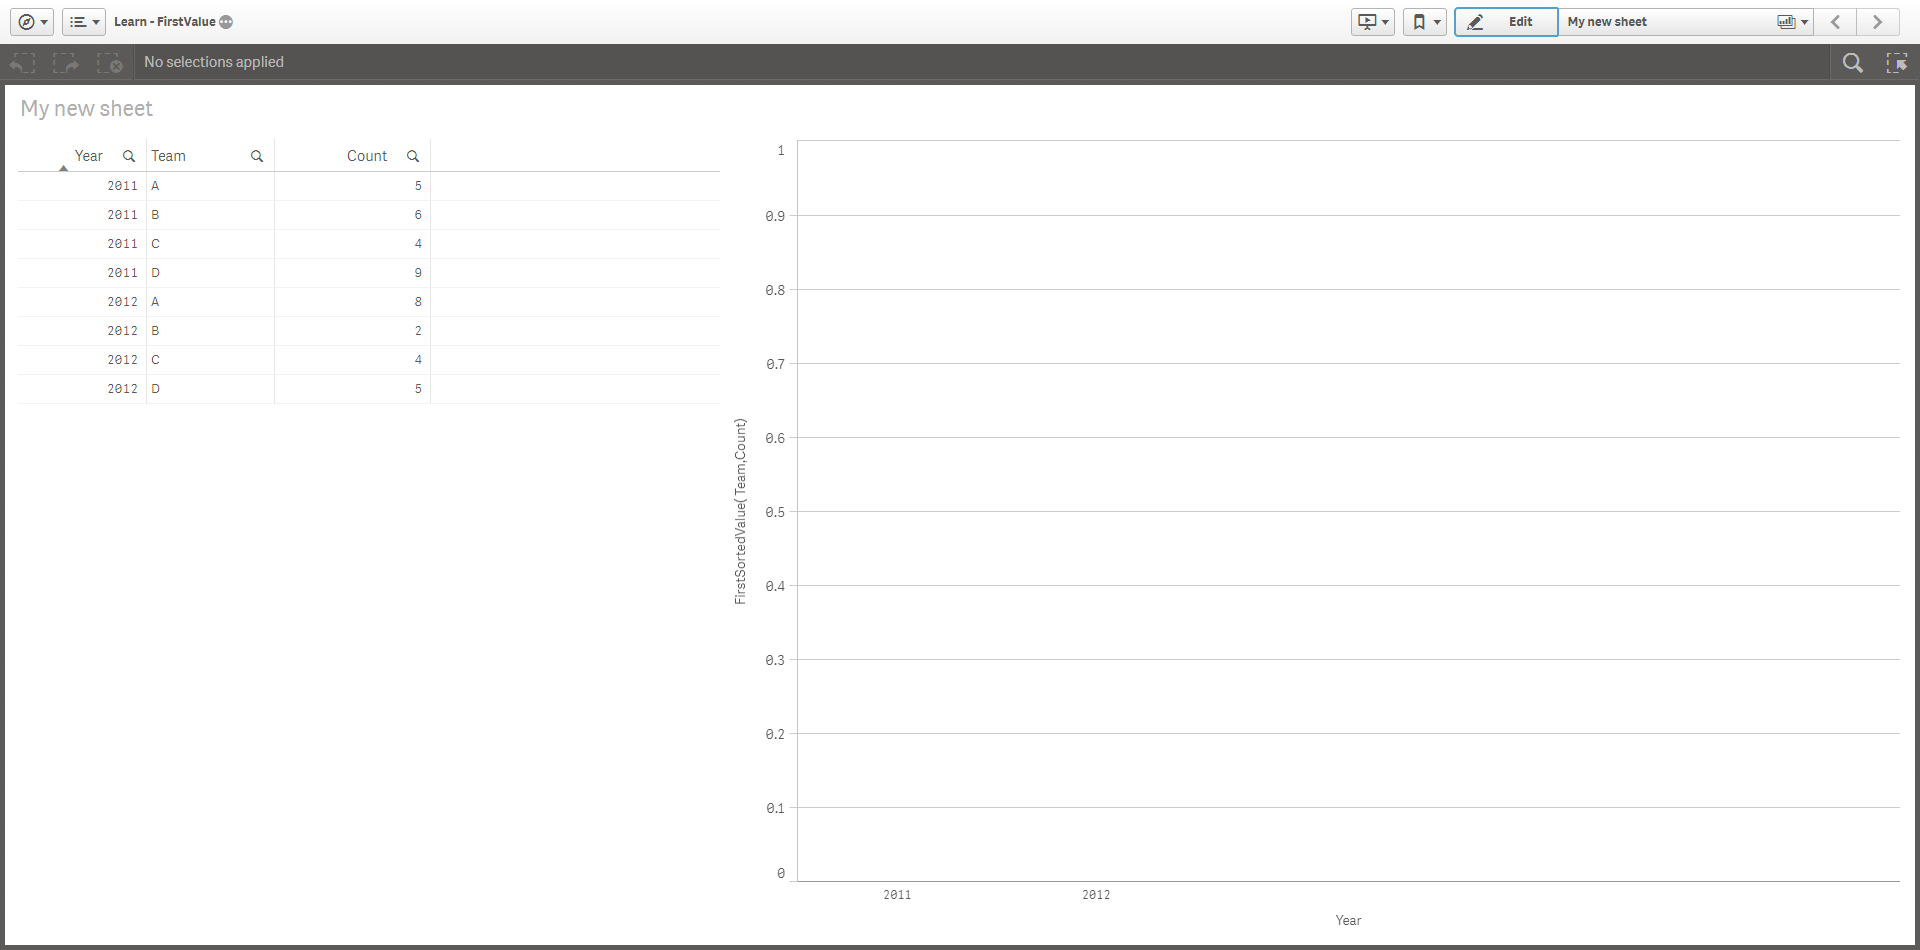
- « Previous Replies
-
- 1
- 2
- Next Replies »