Unlock a world of possibilities! Login now and discover the exclusive benefits awaiting you.
- Qlik Community
- :
- All Forums
- :
- QlikView App Dev
- :
- Sorting in Trellis chart
- Subscribe to RSS Feed
- Mark Topic as New
- Mark Topic as Read
- Float this Topic for Current User
- Bookmark
- Subscribe
- Mute
- Printer Friendly Page
- Mark as New
- Bookmark
- Subscribe
- Mute
- Subscribe to RSS Feed
- Permalink
- Report Inappropriate Content
Sorting in Trellis chart
Hi all,
I'm having some problem sorting the bars in a trellis chart. I want to sort it by the expression value. But it doesn't seems to work.
Any work around for this one?
- Mark as New
- Bookmark
- Subscribe
- Mute
- Subscribe to RSS Feed
- Permalink
- Report Inappropriate Content
Hi,
I thing, it sort right, it sorts now descending in SUM of All values, not only one chart by its own.
- Mark as New
- Bookmark
- Subscribe
- Mute
- Subscribe to RSS Feed
- Permalink
- Report Inappropriate Content
Sorry if my question is not clear. But how can I sort the chart based on the 2nd dimension in trellis? (international & domestic)
- Mark as New
- Bookmark
- Subscribe
- Mute
- Subscribe to RSS Feed
- Permalink
- Report Inappropriate Content
I'm not sure I got your question right...
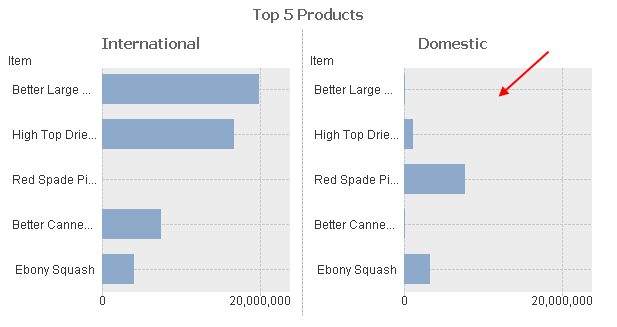
I also think this result is right. You got international first because in total (it seems to be) larger.
You got 'Better Large...' as the first product because the total result makes it the top product.
I think you would like to see 'Red Spade' as the first product for 'Domestic' but the product sorting criteria is independent of the type (international or domestic). I believe this help you compare the results between the dimensions on the trellis.
- Mark as New
- Bookmark
- Subscribe
- Mute
- Subscribe to RSS Feed
- Permalink
- Report Inappropriate Content
Yup... I want Red Spade as the first product for Domestic... this is because I want to create a top 5 Item for each region. So, no work around for this one?
- Mark as New
- Bookmark
- Subscribe
- Mute
- Subscribe to RSS Feed
- Permalink
- Report Inappropriate Content
I'd say the work around would be the creation of two charts. Each one locked to one region by set analysis.
Then,
The expression of the first would be (I don't know the name of your fields, ok)
SUM { <Region = {International}> Sales}
and
SUM { <Region = {Domestic}> Sales}
- Mark as New
- Bookmark
- Subscribe
- Mute
- Subscribe to RSS Feed
- Permalink
- Report Inappropriate Content
Hi,
There might be a way to do this in one Trellis chart depending on how you are calculating your Top 5 - if you can have your Top 5 Rank number as the secondary dimension in the Trellis.
If you also added an expression containing the Item Name (no bar ticked - only 'Values on Data Points') then the rank number would sort the items in the order you want and the extra expression would display the Item name for each bar (you could also tick 'Plot Values inside segments')
If the Rank has to be calculated then add a calculated dimension something like
=if(aggr(rank(sum(Sales)),Origin,Item)<=5,
aggr(rank(sum(Sales)),Origin,Item) )can
Otherwise if you have the Rank Number as a dimension from the script maybe Dual() can be used to sort by a Rank number but display an Item name.
If you post an example doc I'm sure others will contribute more suggestions,
Regards,
HD