Unlock a world of possibilities! Login now and discover the exclusive benefits awaiting you.
- Qlik Community
- :
- All Forums
- :
- QlikView App Dev
- :
- Sorting when dimension is Month
- Subscribe to RSS Feed
- Mark Topic as New
- Mark Topic as Read
- Float this Topic for Current User
- Bookmark
- Subscribe
- Mute
- Printer Friendly Page
- Mark as New
- Bookmark
- Subscribe
- Mute
- Subscribe to RSS Feed
- Permalink
- Report Inappropriate Content
Sorting when dimension is Month
Hi all,
I have built a chart with dimension [Month] and [Year]. The chart by default calculates sales of latest 12 months when there is no selection on [Year], or [Month]. I need to sort the dimension by Year First and then Month.
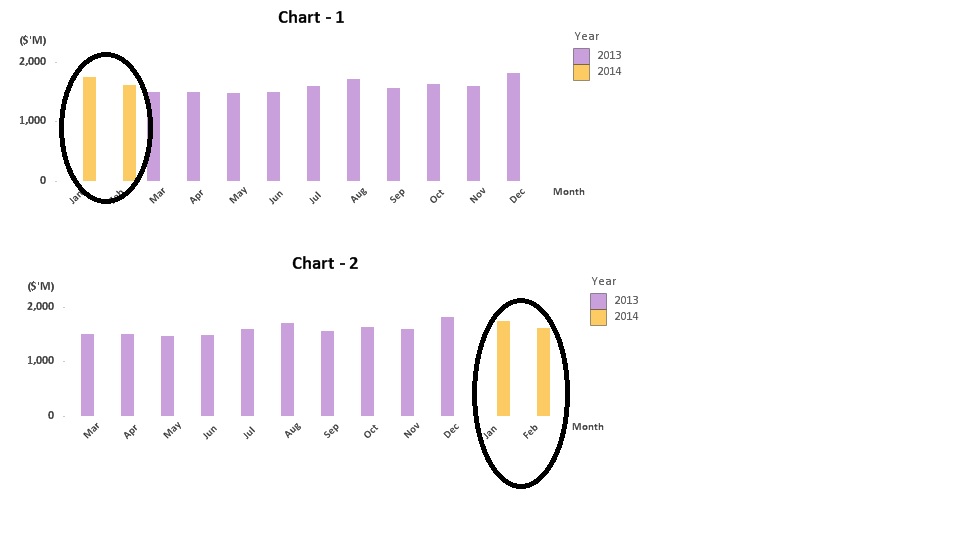
Chart - 1 simply use [Month] as the X- Axis Dimension, this method can't be sorted by Year then by Month.
Chart -2 use Date([Year + Month],'MMM') as X- Axis Dimension, this method can sort the dimension Year then by Month.
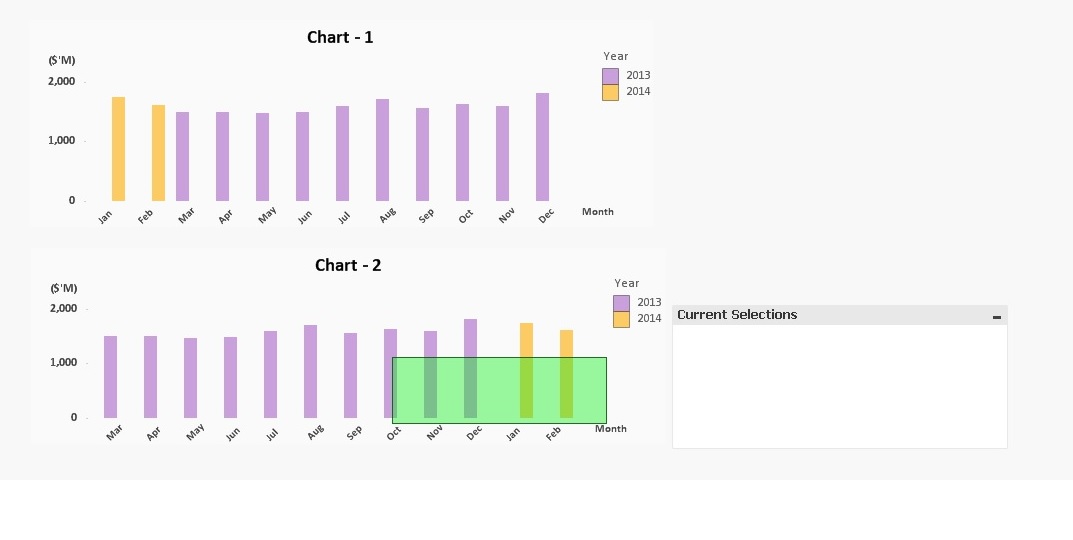
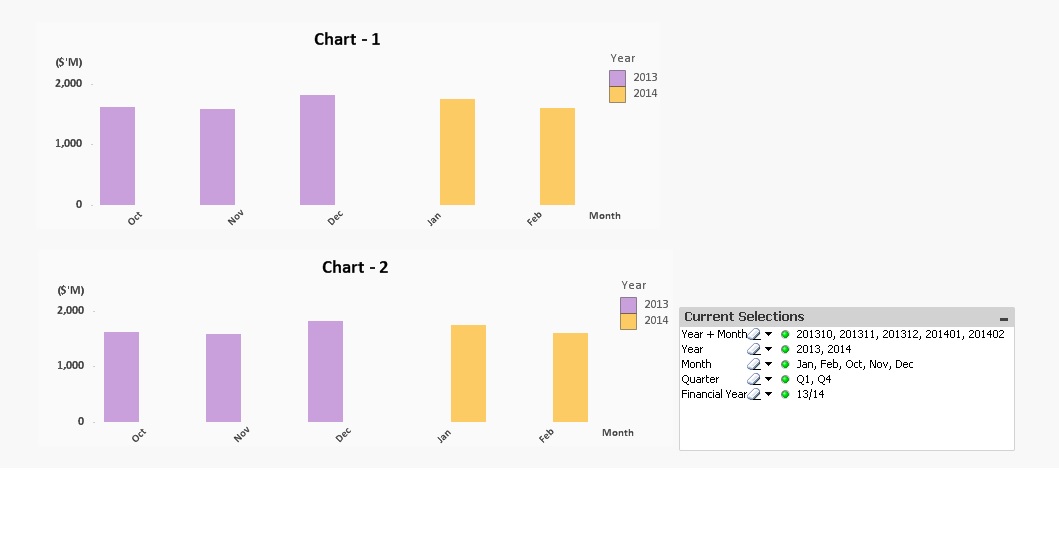
Although the sorting of Chart - 2 is what I expect, when I make some selections(e.g highlight Nov,Dec,Jan,Feb bar) on Chart - 2, the returned current selection is unexpected.
How can I solve the above problem or any other suggestion on the issue?
Please also find the attachment for the case.
Thanks a lot.
- Tags:
- new_to_qlikview
Accepted Solutions
- Mark as New
- Bookmark
- Subscribe
- Mute
- Subscribe to RSS Feed
- Permalink
- Report Inappropriate Content
You're using a calculated dimension. When you select values in this calculated dimension you will actually select values in the all fields used in the calculated dimension and all the fields used as dimensions in your chart. You could try using a calculated dimension that only uses one field: =dual( date(date#([Year + Month],'YYYYMM'),'MMM'),[Year + Month] ). See attached qvw
talk is cheap, supply exceeds demand
- Mark as New
- Bookmark
- Subscribe
- Mute
- Subscribe to RSS Feed
- Permalink
- Report Inappropriate Content
Thx
- Mark as New
- Bookmark
- Subscribe
- Mute
- Subscribe to RSS Feed
- Permalink
- Report Inappropriate Content
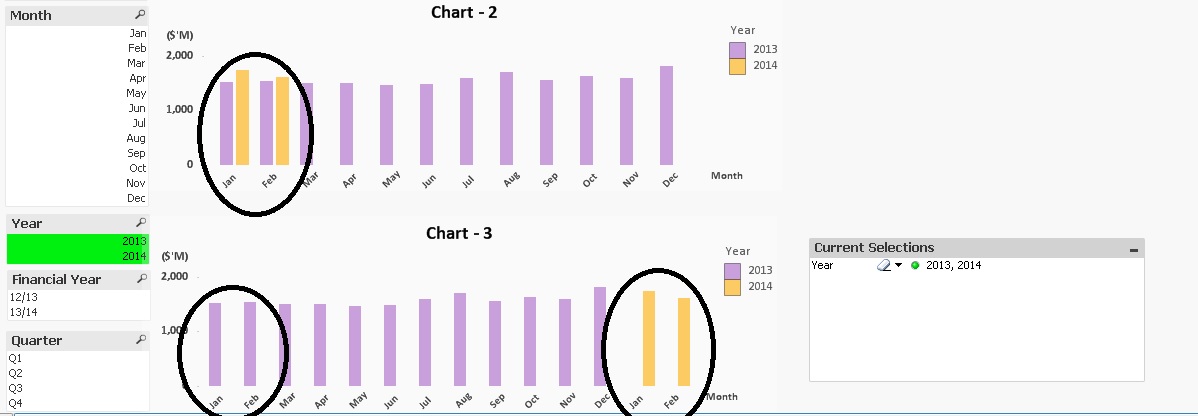
Hi Gysbert,
When I use your method, it works but it induces another problem.
When I select multiple [Year] from listbox, say 2013 and 2014, The chart shows unexpected effect.
Chart -2 is the expected result while Chart -3 is unexpected.
I tried to combine Chart - 2 and Chart -3 Dimension Expression as below but it also failed. Do you have any idea?
=if(GetSelectedCount(Year)=0 and GetSelectedCount([Financial Year])=0 and GetSelectedCount(Quarter)=0 and GetSelectedCount(Month)=0,
dual( date(date#([Year + Month],'YYYYMM'),'MMM'),[Year + Month] ),
Month)