Unlock a world of possibilities! Login now and discover the exclusive benefits awaiting you.
- Qlik Community
- :
- All Forums
- :
- QlikView App Dev
- :
- Re: Sorting y axis in graph
- Subscribe to RSS Feed
- Mark Topic as New
- Mark Topic as Read
- Float this Topic for Current User
- Bookmark
- Subscribe
- Mute
- Printer Friendly Page
- Mark as New
- Bookmark
- Subscribe
- Mute
- Subscribe to RSS Feed
- Permalink
- Report Inappropriate Content
Sorting y axis in graph
I have ranges as shown in the attachment.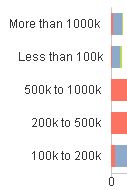
I want to sort it in y axis as :-
More than 1000k
500 to 1000k
200k to 500k
100k to 200k
Less than 100k
0
Note :- Without any hard coding.
- Tags:
- new_to_qlikview
- « Previous Replies
-
- 1
- 2
- Next Replies »
- Mark as New
- Bookmark
- Subscribe
- Mute
- Subscribe to RSS Feed
- Permalink
- Report Inappropriate Content
yep, you are ryt 🙂 , This is a field directly from datasource, ranges are its values
say 'X' field from Datasource and its values are these ranges.
- Mark as New
- Bookmark
- Subscribe
- Mute
- Subscribe to RSS Feed
- Permalink
- Report Inappropriate Content
Hi Try like this
Put load order based on y axis that you using as a dimension
- Mark as New
- Bookmark
- Subscribe
- Mute
- Subscribe to RSS Feed
- Permalink
- Report Inappropriate Content
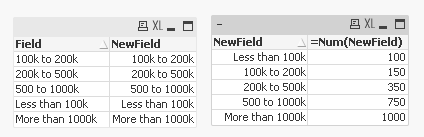
I suggest using Dual function in your script to create numeric values for your fields. For the sample provided, this script should work fine:
Table:
LOAD Field,
Dual(Field, Alt((Num#(KeepChar(SubField(Field, ' ', 1), '0123456789'), '##') + Num#(KeepChar(SubField(Field, ' ', -1), '0123456789'), '##'))/2,
KeepChar(Field, '0123456789'))) as NewField;
LOAD * Inline [
Field
More than 1000k
500 to 1000k
200k to 500k
100k to 200k
Less than 100k
];
Where NewField looks like your ranges, but they also have associated value with them which can then be sorted in ascending or descending values
- Mark as New
- Bookmark
- Subscribe
- Mute
- Subscribe to RSS Feed
- Permalink
- Report Inappropriate Content
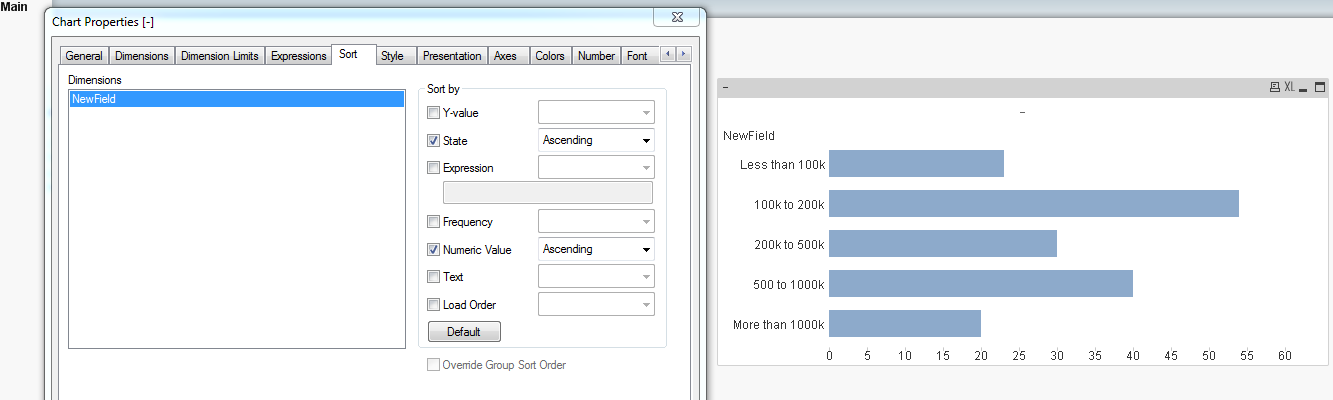
Chart would look like this:
- Mark as New
- Bookmark
- Subscribe
- Mute
- Subscribe to RSS Feed
- Permalink
- Report Inappropriate Content
Yeah its working,
Thank you Sunny 🙂
- Mark as New
- Bookmark
- Subscribe
- Mute
- Subscribe to RSS Feed
- Permalink
- Report Inappropriate Content
Awesome 
I am glad it is working the way you wanted
Best,
Sunny
- Mark as New
- Bookmark
- Subscribe
- Mute
- Subscribe to RSS Feed
- Permalink
- Report Inappropriate Content
Yeah, its working as I expected.
Thanks much Sunny
- « Previous Replies
-
- 1
- 2
- Next Replies »