Unlock a world of possibilities! Login now and discover the exclusive benefits awaiting you.
- Qlik Community
- :
- All Forums
- :
- QlikView App Dev
- :
- Spacing of values on X-axis
Options
- Subscribe to RSS Feed
- Mark Topic as New
- Mark Topic as Read
- Float this Topic for Current User
- Bookmark
- Subscribe
- Mute
- Printer Friendly Page
Turn on suggestions
Auto-suggest helps you quickly narrow down your search results by suggesting possible matches as you type.
Showing results for
Not applicable
2013-06-12
05:31 AM
- Mark as New
- Bookmark
- Subscribe
- Mute
- Subscribe to RSS Feed
- Permalink
- Report Inappropriate Content
Spacing of values on X-axis
Hi,
In a line chart, I defined at the Presentation tab, 20 visible values, and to show a scroll bar.
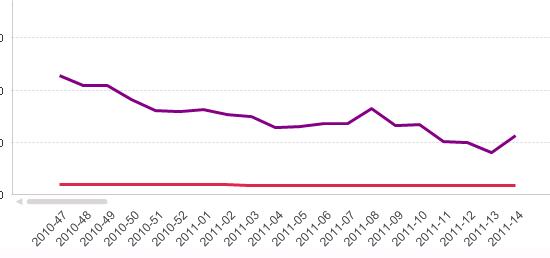
When no values are selected, there is a large space. Only 2 periods are displayed on the X-axis. (see attached pic Wide)
If I scroll, I see the rest of the preiods.
When selecting a few values, more values are selected, as desired (see Narrow pic attached).
Why does it happen?
How do I make the periods values display more condensed?
Thanks!
- Tags:
- new_to_qlikview
413 Views
1 Reply
Master III
2013-06-12
05:36 AM
- Mark as New
- Bookmark
- Subscribe
- Mute
- Subscribe to RSS Feed
- Permalink
- Report Inappropriate Content
Try to Supress null and missing values
319 Views