Unlock a world of possibilities! Login now and discover the exclusive benefits awaiting you.
- Qlik Community
- :
- All Forums
- :
- QlikView App Dev
- :
- Stacked bars problem
- Subscribe to RSS Feed
- Mark Topic as New
- Mark Topic as Read
- Float this Topic for Current User
- Bookmark
- Subscribe
- Mute
- Printer Friendly Page
- Mark as New
- Bookmark
- Subscribe
- Mute
- Subscribe to RSS Feed
- Permalink
- Report Inappropriate Content
Stacked bars problem
Hi!
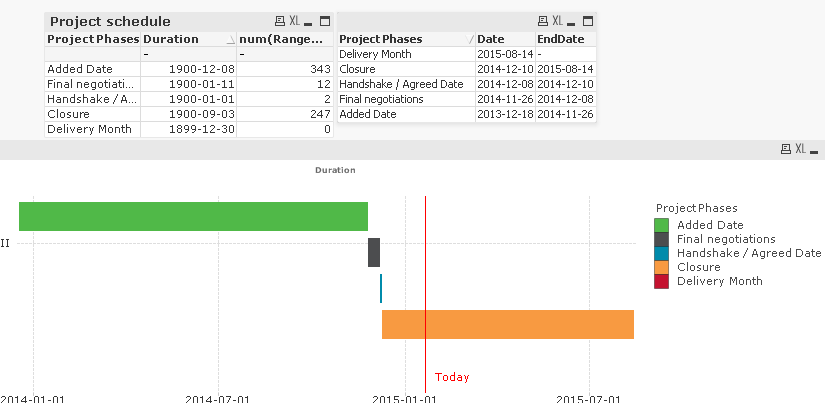
I have a problem with stacked bars. I am trying to create a Gantt chart of project phases based on this instruction: http://community.qlik.com/docs/DOC-3113. As you can see in the picture, the chart works ok in grouped but when I try to stack the bars only the green one is showing and the others disappear. Is it because the 'Delivery Month' doesn't have an end date and therefore zero values exist? Or could there be other reason for the disappearance? The end date is created of the 'Date' of next phase and the last phase doesn't have anything to create the end date from. Any idea how to fix the problem or do the chart using other methods?
Thanks for your help!
Regards,
Heidi
- Mark as New
- Bookmark
- Subscribe
- Mute
- Subscribe to RSS Feed
- Permalink
- Report Inappropriate Content
Hi HeidiKor,
Don't Do Stacked use Grouped, because to create a stacked bar need at least two dimension.
-Sateesh Tokala
- Mark as New
- Bookmark
- Subscribe
- Mute
- Subscribe to RSS Feed
- Permalink
- Report Inappropriate Content
I have two dimensions. Project phases and Project name, the example chart only has one project as an example.
- Mark as New
- Bookmark
- Subscribe
- Mute
- Subscribe to RSS Feed
- Permalink
- Report Inappropriate Content
Have you used Bar offset in your chart?
- Mark as New
- Bookmark
- Subscribe
- Mute
- Subscribe to RSS Feed
- Permalink
- Report Inappropriate Content
Yes it is min(Date) for the only expression I have.