Unlock a world of possibilities! Login now and discover the exclusive benefits awaiting you.
- Qlik Community
- :
- All Forums
- :
- QlikView App Dev
- :
- Straight Table - Calculate Mini Chart Trend
- Subscribe to RSS Feed
- Mark Topic as New
- Mark Topic as Read
- Float this Topic for Current User
- Bookmark
- Subscribe
- Mute
- Printer Friendly Page
- Mark as New
- Bookmark
- Subscribe
- Mute
- Subscribe to RSS Feed
- Permalink
- Report Inappropriate Content
Straight Table - Calculate Mini Chart Trend
I have a Straight Table that displays a Mini Chart showing a 6 month trend of monthly data for each row. I would like to add a column with a visual indicator (an arrow image) that will read the last 3 months of the Mini Chart data and indicate if they are all trending downward (show a down arrow) or trending upward (up arrow). If possible, if the trend is flat display a sideways arrow.
I haven't been able to figure out how to associate the value with each of the last 3 months of the trend.
Please find attached a sample of the qvw and the data source.
Thanks
Jeff
- Mark as New
- Bookmark
- Subscribe
- Mute
- Subscribe to RSS Feed
- Permalink
- Report Inappropriate Content
Maybe you can use this attached sample as a starting point.
- Mark as New
- Bookmark
- Subscribe
- Mute
- Subscribe to RSS Feed
- Permalink
- Report Inappropriate Content
Hi Jeffrey,
Not sure about the expression how to get it , but you can take one more expression, "Representation" as Image
and goto the expression definition editor
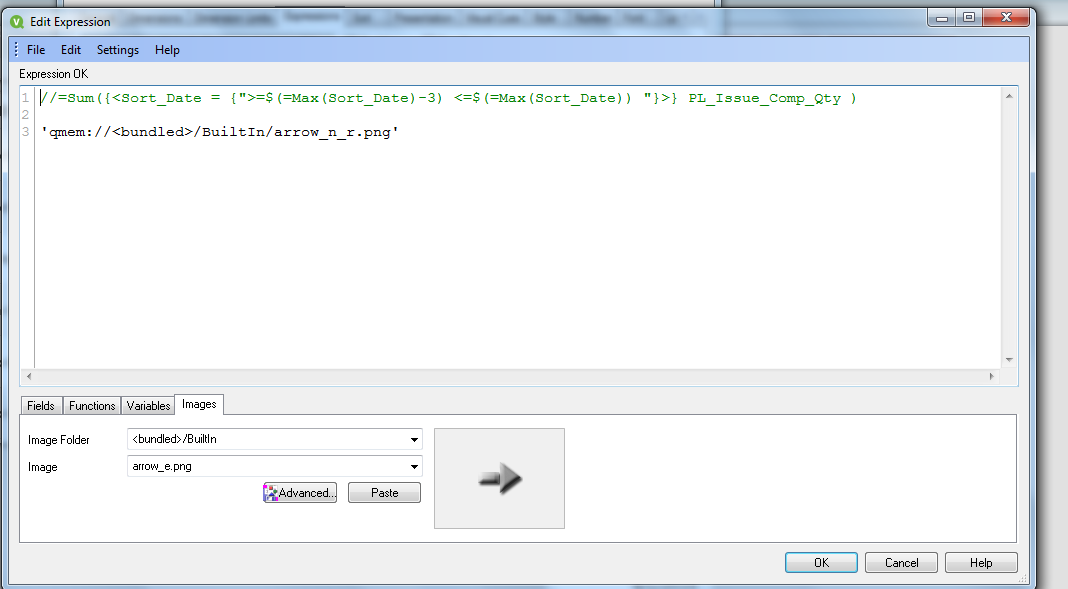
write an if condition based on the if condition and use the 'qmem'
Hope you got the point how to get arrows , also check " advanced" button.