Unlock a world of possibilities! Login now and discover the exclusive benefits awaiting you.
- Qlik Community
- :
- All Forums
- :
- QlikView App Dev
- :
- Straight Table: Layout & Load Format
- Subscribe to RSS Feed
- Mark Topic as New
- Mark Topic as Read
- Float this Topic for Current User
- Bookmark
- Subscribe
- Mute
- Printer Friendly Page
- Mark as New
- Bookmark
- Subscribe
- Mute
- Subscribe to RSS Feed
- Permalink
- Report Inappropriate Content
Straight Table: Layout & Load Format
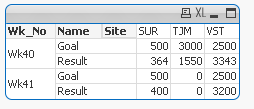
I'm trying to create what seems to be a simple straight table, but can't figure it out. I want the table to look similar to this on the dashboard:
I have 4 data points: Wk_No, Site, Result & Goal. The idea is the sites are listed across the top with the associated Result listed below and the associated Goal below that (see example). The Wk_No would be a list box I use filter what week to display (and I want the current, or last week to default).
Example:
| SUR | VST | TJM |
|---|---|---|
| 364 | 3,343 | 1,550 |
| 500 | 2,500 | 3,000 |
I have the luxury of setting up the data that is loaded into the dashboard (either excel or access).
Should go with a "stacked"?:
| Wk_No | Site | Goal | Result |
|---|---|---|---|
| Wk40 | SUR | 500 | 364 |
| Wk40 | VST | 2500 | 3343 |
| Wk40 | TJM | 3000 | 1550 |
| Wk41 | SUR | 500 | 400 |
| Wk41 | VST | 2500 | 3200 |
Or is there another format I should use?
I've tried several way to create a straight table, but cannot get the Sites to list across the top. I've been off QlikView for about 4 months and seem to have forgotten a lot!
Thanks for the help.
Jeff
- Tags:
- straight tables
- Mark as New
- Bookmark
- Subscribe
- Mute
- Subscribe to RSS Feed
- Permalink
- Report Inappropriate Content
Did you try pivot table where you can pull your Site dimension to top. Like below?
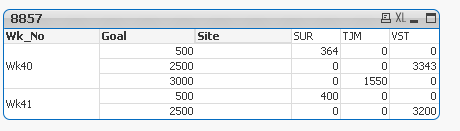
Or may be this?
CrossTable(Name, Value, 2)
LOAD Wk_No, Site, Goal, Result INLINE [
Wk_No, Site, Goal, Result
Wk40, SUR, 500, 364
Wk40, VST, 2500, 3343
Wk40, TJM, 3000, 1550
Wk41, SUR, 500, 400
Wk41, VST, 2500, 3200
];