Unlock a world of possibilities! Login now and discover the exclusive benefits awaiting you.
- Qlik Community
- :
- All Forums
- :
- QlikView App Dev
- :
- Strange(Confused) line chart when using show other...
- Subscribe to RSS Feed
- Mark Topic as New
- Mark Topic as Read
- Float this Topic for Current User
- Bookmark
- Subscribe
- Mute
- Printer Friendly Page
- Mark as New
- Bookmark
- Subscribe
- Mute
- Subscribe to RSS Feed
- Permalink
- Report Inappropriate Content
Strange(Confused) line chart when using show others and show total together in Dimension limit
Hi all,
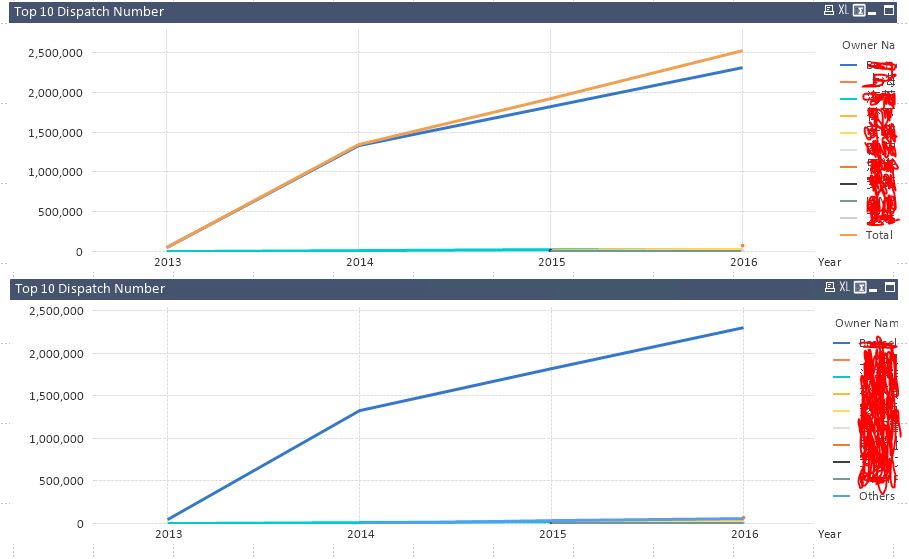
I met a strange issue, I don't know whether it's a bug or not. I created a line chart to show top 10 order numbers by company using
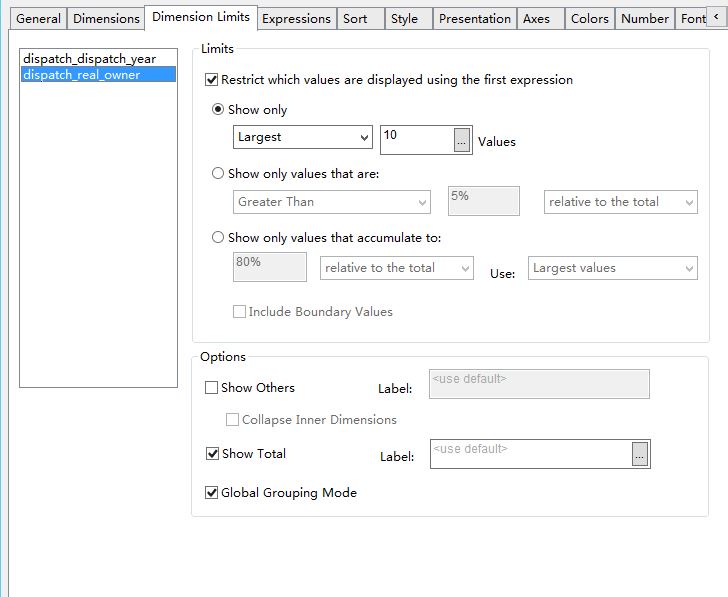
And it shows well and also when I using show others :
But when I select show others and show total together, the line chart change to :
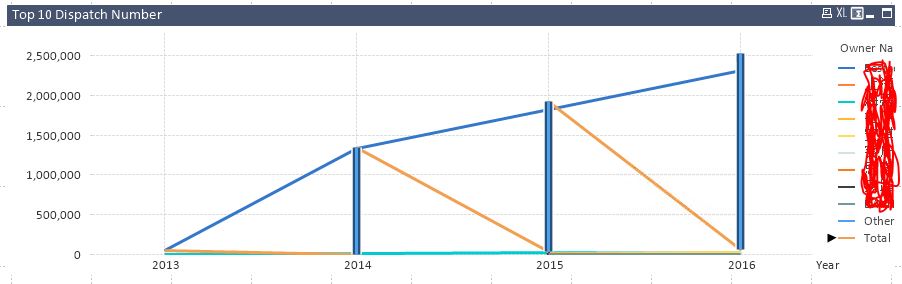
You can see that the table confuse the other and total, and I don't know why...
Dimension : 1. year 2. company
expression: count ( order )
There are some orders that don't have company, so I suppress the null in company dimension, I don't know whether it will influence.
Do you know how to solve that ?
If you need any other information please tell me.
Thanks.
Aiolos Zhao
- Mark as New
- Bookmark
- Subscribe
- Mute
- Subscribe to RSS Feed
- Permalink
- Report Inappropriate Content
Anyone knows what's the matter with this?
- Mark as New
- Bookmark
- Subscribe
- Mute
- Subscribe to RSS Feed
- Permalink
- Report Inappropriate Content
Any ideas about this?
- Mark as New
- Bookmark
- Subscribe
- Mute
- Subscribe to RSS Feed
- Permalink
- Report Inappropriate Content
When you check 'Show total' , the graph is showing total for that particular year with normal trend. I think you better uncheck that.
I don't see any requirement to show total in the mentioned chart.
Thank you 
- Mark as New
- Bookmark
- Subscribe
- Mute
- Subscribe to RSS Feed
- Permalink
- Report Inappropriate Content
Hi Pavan,
Thanks for reply, and I also just want to show others, but my boss wants show total and show others, then I find the bug.
Well, do you know why?
Thanks.
Aiolos Zhao