Unlock a world of possibilities! Login now and discover the exclusive benefits awaiting you.
- Qlik Community
- :
- All Forums
- :
- QlikView App Dev
- :
- Stuck with SQL problems
- Subscribe to RSS Feed
- Mark Topic as New
- Mark Topic as Read
- Float this Topic for Current User
- Bookmark
- Subscribe
- Mute
- Printer Friendly Page
- Mark as New
- Bookmark
- Subscribe
- Mute
- Subscribe to RSS Feed
- Permalink
- Report Inappropriate Content
Stuck with SQL problems
Hello! I have a trouble, and would be really happy if you could help me 
First, this i my SQL selections from a ODBC.
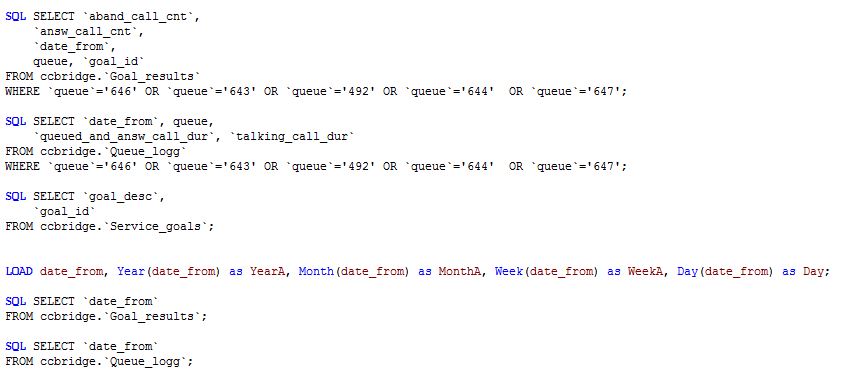
This works perfect. I make plots of this to see different answ_call_cnt and aband_call_cnt with the different queues. And i make selections with Year, month and day. Nemas problemas!
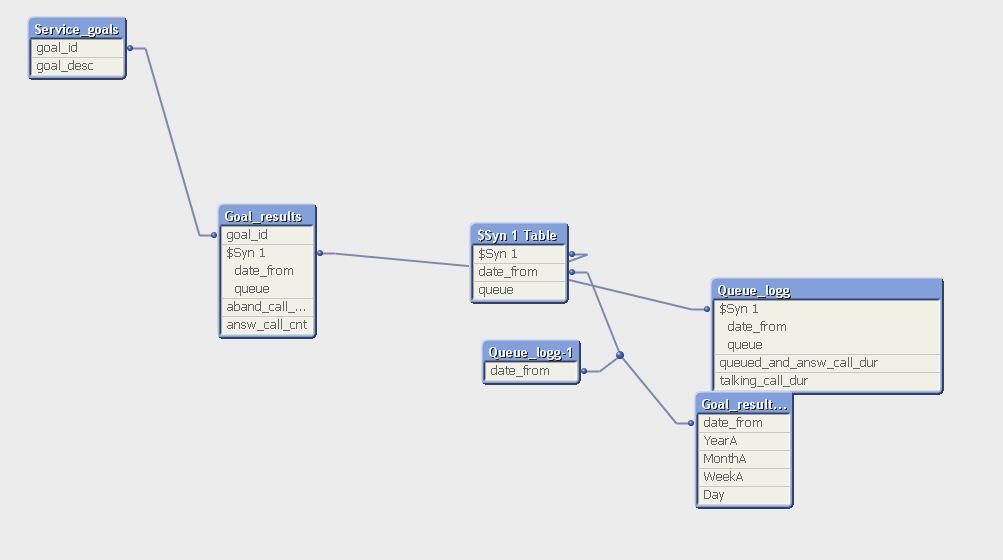
But my Table viewer is quite hard to understand.
Because now i would like to import some agent_name from the Agent_logg. See picture below.
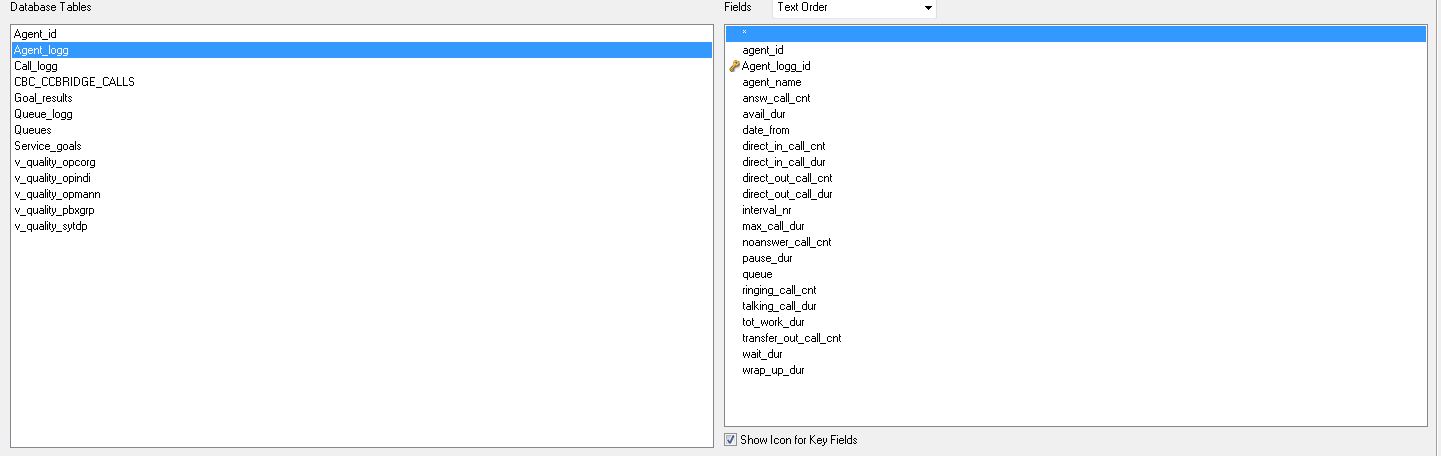
But i don't get it to work 😕
Any input would be greats. I can't post a sample file because im on a private license and connected to ODBC.
- Tags:
- new_to_qlikview
- « Previous Replies
-
- 1
- 2
- Next Replies »
- Mark as New
- Bookmark
- Subscribe
- Mute
- Subscribe to RSS Feed
- Permalink
- Report Inappropriate Content
I think you are right, can you show me how to do it? Because im a newbie regarding SQL and databases.
Thanks.
- Mark as New
- Bookmark
- Subscribe
- Mute
- Subscribe to RSS Feed
- Permalink
- Report Inappropriate Content
cnt = count is correct. But i think it is aggregated at each level.
- Mark as New
- Bookmark
- Subscribe
- Mute
- Subscribe to RSS Feed
- Permalink
- Report Inappropriate Content
You need to bring in the view that has the agent_logg_id - once you've loaded that into the QV script - the joins should be quite clear when you look at the other imported data and PK's
Just do a Load *, from a SQL Select * query, and you'll see all the fields.
I came from a call centre background and know how difficult it is tracking individual advisors to calls in a queue - the issue I had was the queue was measured on a vdn level, and advisors tracked on the skills - best thing though, is to being everything into QV and then disregard what you don't need.
Try to avoid syntheic keys where possible - they only cause issues further down the line.
- « Previous Replies
-
- 1
- 2
- Next Replies »