Unlock a world of possibilities! Login now and discover the exclusive benefits awaiting you.
- Qlik Community
- :
- All Forums
- :
- QlikView App Dev
- :
- Sum Problem with Chart
- Subscribe to RSS Feed
- Mark Topic as New
- Mark Topic as Read
- Float this Topic for Current User
- Bookmark
- Subscribe
- Mute
- Printer Friendly Page
- Mark as New
- Bookmark
- Subscribe
- Mute
- Subscribe to RSS Feed
- Permalink
- Report Inappropriate Content
Sum Problem with Chart
Hi all,
I've got a problem that is making me cry. Below is the entries from a table box for a particular job on my report. As you can see the Total Price fields add up to about 1073.
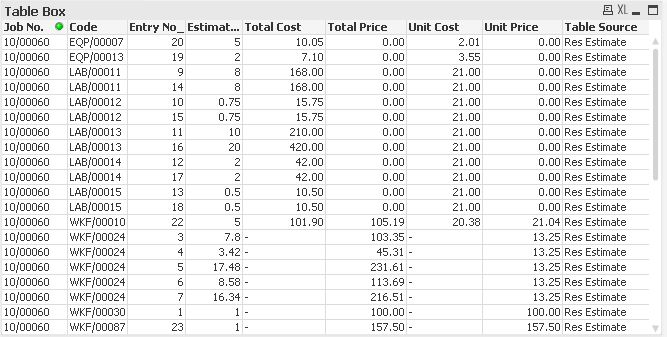
The problem is that as soon as I try to put this into a chart it multiplies some of the lines by 5:
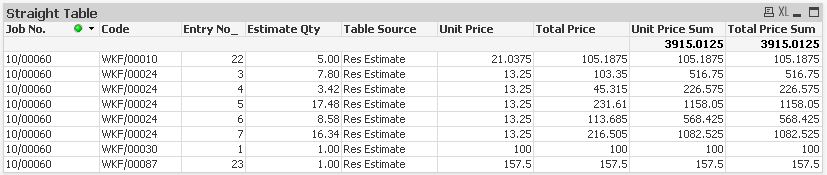
As you can see, the Total Price field looks ok but the Total Price Sum column (using expression "sum({<[Table Source]={'Res Estimate'}>} [Total Price])")
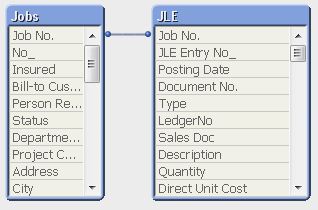
calcuates the value to exactly 5 times more. Below is a screenshot of the table structure, it's pretty simple:
I'm completely stumped. Does anyone have any ideas I could try? Or any suggestions as to what might be going wrong?
Regards,
Chris
- Mark as New
- Bookmark
- Subscribe
- Mute
- Subscribe to RSS Feed
- Permalink
- Report Inappropriate Content
Chris,
please note that AFAIK the table box will not show duplicate rows.
I assume you indeed have 5 entries in your table where the sum is 5x the single row value (as you stated, not for all Job No / Codes, but for some).
I think you need to get finer detail of your data, e.g. by adding approriate dimensions to your table, to see where these duplicate rows come from. You could also try to use count() to verify that my assumption is correct (e.g. count([Total Price]) )
Stefan
- Mark as New
- Bookmark
- Subscribe
- Mute
- Subscribe to RSS Feed
- Permalink
- Report Inappropriate Content
Trouble shooting tip:
- Select one "problem row" in your chart
- Identify all data field names on a "problem row" in your chart
- Create a table boc containing all the data fields from 2
Your table box will now show which data fields contain multiple values and thereby make you cry 
- Mark as New
- Bookmark
- Subscribe
- Mute
- Subscribe to RSS Feed
- Permalink
- Report Inappropriate Content
.. and then you either:
- Clean up your data model
or - Change your formula