Unlock a world of possibilities! Login now and discover the exclusive benefits awaiting you.
- Qlik Community
- :
- All Forums
- :
- QlikView App Dev
- :
- Sum and Count at the bottom of the same table.
- Subscribe to RSS Feed
- Mark Topic as New
- Mark Topic as Read
- Float this Topic for Current User
- Bookmark
- Subscribe
- Mute
- Printer Friendly Page
- Mark as New
- Bookmark
- Subscribe
- Mute
- Subscribe to RSS Feed
- Permalink
- Report Inappropriate Content
Sum and Count at the bottom of the same table.
Dear all
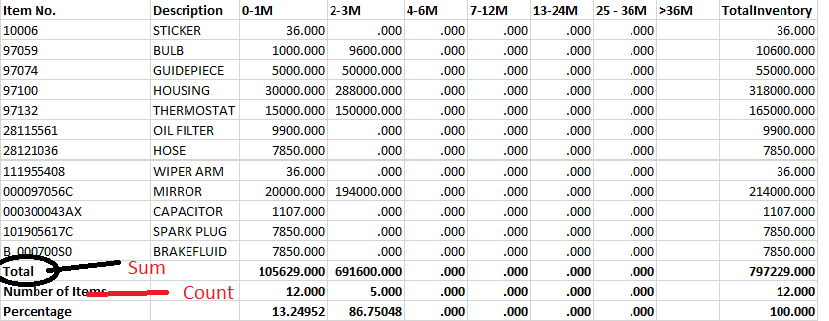
I have requirement in which I need count of items and sum of items in the bottom row as mentioned in the image in a straight or pivot table.
But in Single object not in multiple objects.
Please suggest me.
- Mark as New
- Bookmark
- Subscribe
- Mute
- Subscribe to RSS Feed
- Permalink
- Report Inappropriate Content
Are you trying to get this?
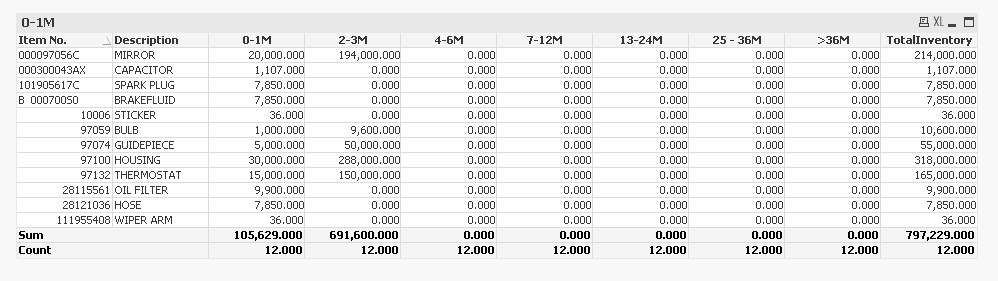
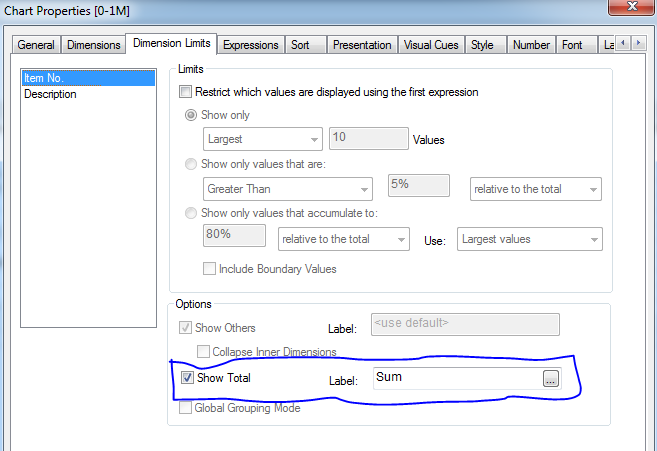
For Sum I used the Total on Dimension Limits tab:
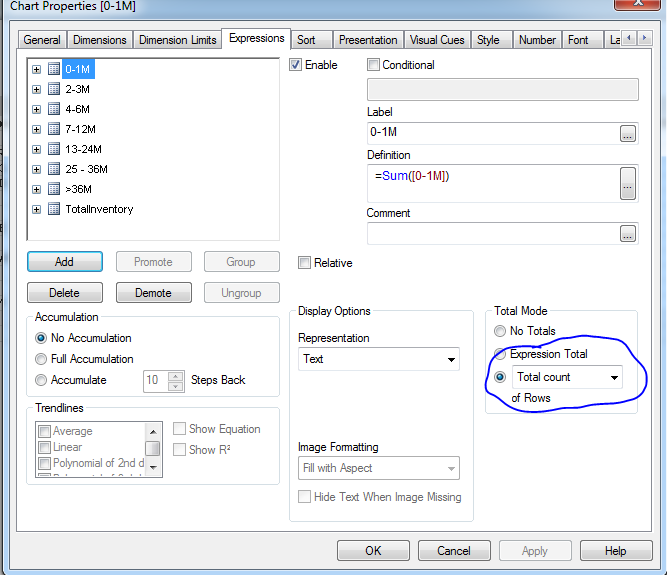
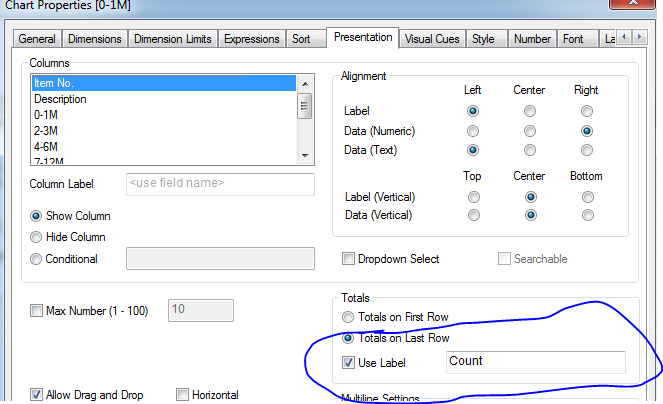
For Count I used the Total on the Expression tab and gave it the label on Presentation tab:
- Mark as New
- Bookmark
- Subscribe
- Mute
- Subscribe to RSS Feed
- Permalink
- Report Inappropriate Content
Hi Sunny n Kuczynska, I need count of only the values present greater than 0. !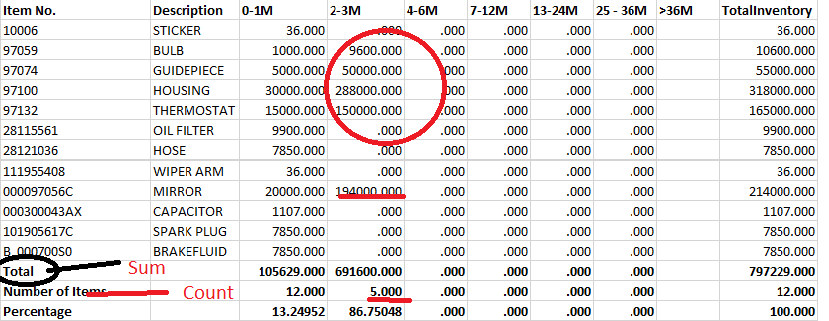
!
- Mark as New
- Bookmark
- Subscribe
- Mute
- Subscribe to RSS Feed
- Permalink
- Report Inappropriate Content
This?
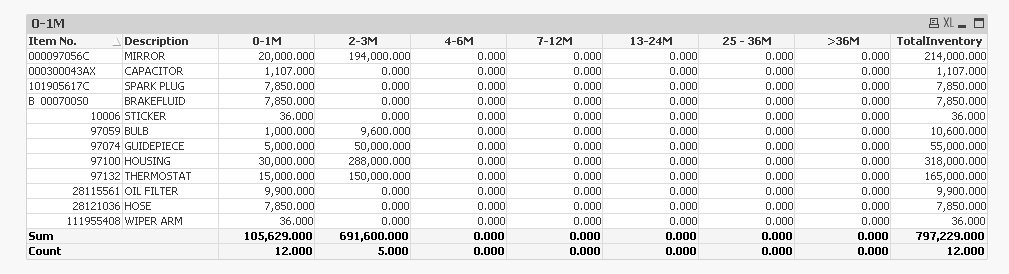
Changed the expressions a little bit:
Expression1: =If(Sum([0-1M]) <> 0, Sum([0-1M])) (from Sum([0-1M]))
and so on....
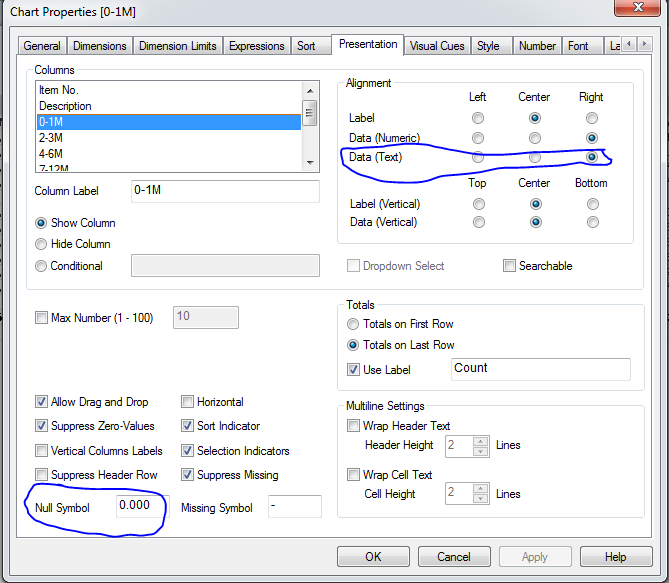
Also changed the Null Symbol from - to 0.000 and made it right justified on presentation tab:
I hope this will help.
Best,
Sunny
- Mark as New
- Bookmark
- Subscribe
- Mute
- Subscribe to RSS Feed
- Permalink
- Report Inappropriate Content
That was very helpful, Sunny.
Is it possible to have a percentage column below count where the formula is total of 0-1M / total inventory for 0-1 M and total of 0-2M/total Inventory for 0-2 n so on..?
- Mark as New
- Bookmark
- Subscribe
- Mute
- Subscribe to RSS Feed
- Permalink
- Report Inappropriate Content
I don't think we can have 3 Total columns, I can recommend another solution where you can have three totals in the one row instead of 3. Do you think that would work???
- Mark as New
- Bookmark
- Subscribe
- Mute
- Subscribe to RSS Feed
- Permalink
- Report Inappropriate Content
Please suggest, Lets me see it works or not
- Mark as New
- Bookmark
- Subscribe
- Mute
- Subscribe to RSS Feed
- Permalink
- Report Inappropriate Content
Sunny !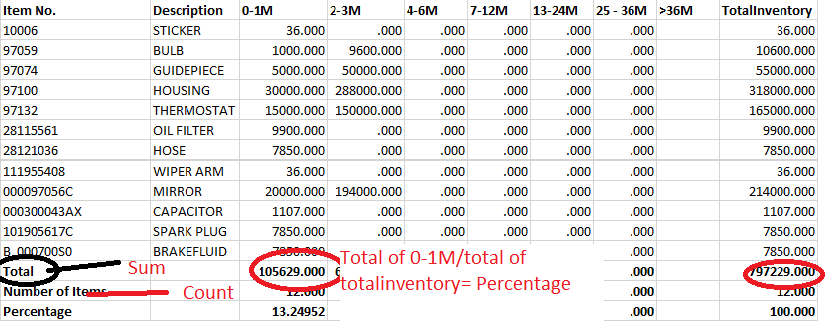 , the third total should take the formula as I have mentioned
- Mark as New
- Bookmark
- Subscribe
- Mute
- Subscribe to RSS Feed
- Permalink
- Report Inappropriate Content
This is the alternative method I was talking about:
Expression1:
=If(Dimensionality() = 0, Num(Sum([0-1M]), '#,##0.000') & Chr(10) &
Num(Count([0-1M]), '#,##0.000') & Chr(10) &
Num(Sum([0-1M])/Sum(TotalInventory), '#,##0.00%'),
Num(Sum([0-1M]), '#,##0.000'))
Output:
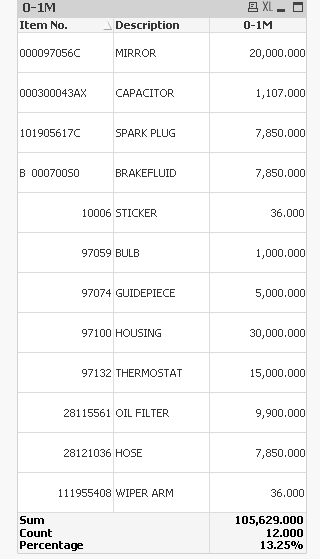
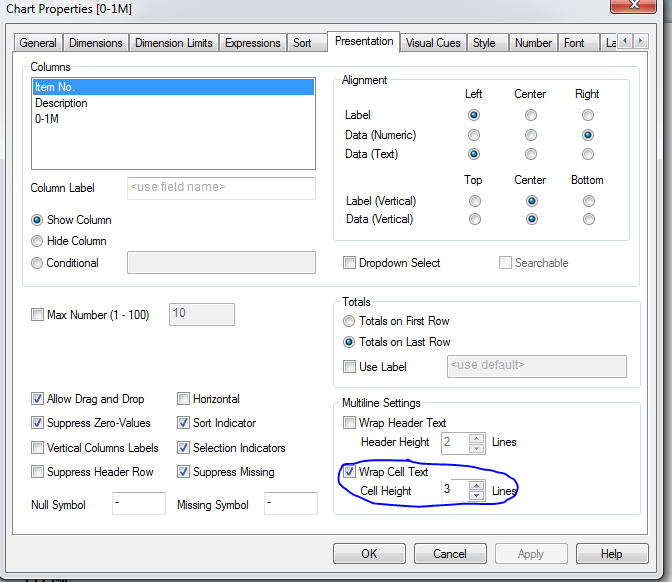
Only drawback here is that since we need three totals at the bottom, the complete chart needs to have cell height of 3:
Also attaching the qvw for reference.
HTH
Best,
Sunny
- Mark as New
- Bookmark
- Subscribe
- Mute
- Subscribe to RSS Feed
- Permalink
- Report Inappropriate Content
Hi Sunny,
Thanks a lot for your help.
Your mentioned solution worked well in QV but when we extract to Excel we need to Manually wrap the column.
Is there any Similar solution where we just need to pull the data to excel and it will be in similar format.
- Mark as New
- Bookmark
- Subscribe
- Mute
- Subscribe to RSS Feed
- Permalink
- Report Inappropriate Content
Hey Rahul -
Unfortunately, these are the only two methods I knew to show more than two totals in a table. If there is a third method, I would be more than happy to know about it.
I hope someone can help you out with this.
Best,
Sunny