Unlock a world of possibilities! Login now and discover the exclusive benefits awaiting you.
- Qlik Community
- :
- All Forums
- :
- QlikView App Dev
- :
- Sum of Columns in Pivot table
- Subscribe to RSS Feed
- Mark Topic as New
- Mark Topic as Read
- Float this Topic for Current User
- Bookmark
- Subscribe
- Mute
- Printer Friendly Page
- Mark as New
- Bookmark
- Subscribe
- Mute
- Subscribe to RSS Feed
- Permalink
- Report Inappropriate Content
Sum of Columns in Pivot table
Hi all, I'm not sure if I'm missing a trick but I have a requirement where I have to show the Sum of measures of a row in a Pivot table but with dimensions going across and the measures going down, e.g.
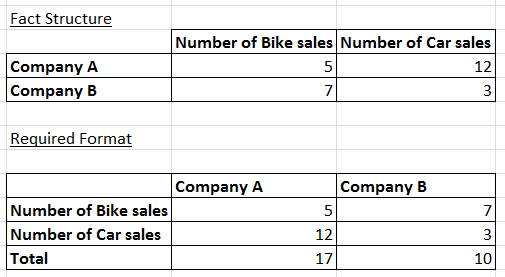
Any help appreciated!
Many thanks
- « Previous Replies
-
- 1
- 2
- Next Replies »
Accepted Solutions
- Mark as New
- Bookmark
- Subscribe
- Mute
- Subscribe to RSS Feed
- Permalink
- Report Inappropriate Content
- Mark as New
- Bookmark
- Subscribe
- Mute
- Subscribe to RSS Feed
- Permalink
- Report Inappropriate Content
Go to the Presentation tab and in the top-left corner, turn on "Show Partial Sum".
You might need to play a bit with on which dimension to turn this on before you figured out which is the correct one.
- Mark as New
- Bookmark
- Subscribe
- Mute
- Subscribe to RSS Feed
- Permalink
- Report Inappropriate Content
Are you using the Sales as Dimension or Customer?
The first Table shows Customer as Dimension and the second shows Sales.
I hope you have not Transposed the Dimension to Column.
If possible, please upload the App.
- Mark as New
- Bookmark
- Subscribe
- Mute
- Subscribe to RSS Feed
- Permalink
- Report Inappropriate Content
Hi, thanks for the reply, however I did already try this but it simply moves back the Dimensions from column format (across the top) back to row format, I think it needs maybe another Expression to be used as a Total of all values for a row but really not sure.
- Mark as New
- Bookmark
- Subscribe
- Mute
- Subscribe to RSS Feed
- Permalink
- Report Inappropriate Content
Create the the Expression Total using column(1)+column(2)
Now you cab simply drag the expression to Column and drag the dimension to raw if you are using pivot table
- Mark as New
- Bookmark
- Subscribe
- Mute
- Subscribe to RSS Feed
- Permalink
- Report Inappropriate Content
See if this can help.
- Mark as New
- Bookmark
- Subscribe
- Mute
- Subscribe to RSS Feed
- Permalink
- Report Inappropriate Content
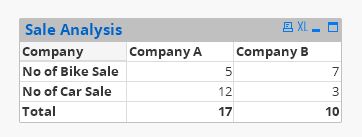
Hi, the original source data is in the format of the second table (i.e. Company Name being a column, not a Dimension), however on import I have modeled it correctly having Company as Dimension and sales as measures, the problem is I still need to display it in the old format having Company as Columns and the sales measures appearing in Row format.
I currently have this Pivot chart in Qlikview but just can't get the Total to show as the last row so summing all sale types per company.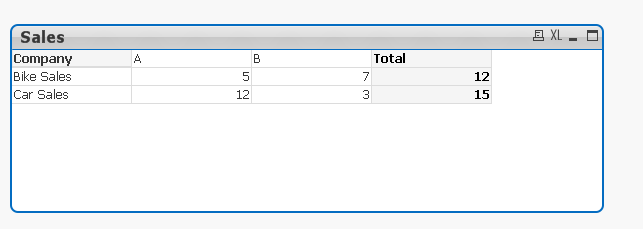
- Mark as New
- Bookmark
- Subscribe
- Mute
- Subscribe to RSS Feed
- Permalink
- Report Inappropriate Content
Many thanks guys, I was hoping not having to hard code all the fields as I have about 20-30 of them but it does look like in this instance I'm rather limited on solutions.
I've got a macro which creates the chart anyhow so will just try added some extra logic to create the Total expression field.
Cheers!
- Mark as New
- Bookmark
- Subscribe
- Mute
- Subscribe to RSS Feed
- Permalink
- Report Inappropriate Content
Not sure what you mean with "hard code all fields"?
- Mark as New
- Bookmark
- Subscribe
- Mute
- Subscribe to RSS Feed
- Permalink
- Report Inappropriate Content
Well in my fact I have lets say 20 expressions, to sum all of them wouldn't I need to add each field name by hard coding the field names or doing Column(1) + Column(2) .., or is there a dynamic way of doing this, something like
=concat('if(isnull([' & [FieldName] & ']),0,' & '[' & [FieldName] & ']' & ')' & ' + ')
Thanks!
- « Previous Replies
-
- 1
- 2
- Next Replies »