Unlock a world of possibilities! Login now and discover the exclusive benefits awaiting you.
- Qlik Community
- :
- All Forums
- :
- QlikView App Dev
- :
- Sum of aggr() deos not return the expected array o...
- Subscribe to RSS Feed
- Mark Topic as New
- Mark Topic as Read
- Float this Topic for Current User
- Bookmark
- Subscribe
- Mute
- Printer Friendly Page
- Mark as New
- Bookmark
- Subscribe
- Mute
- Subscribe to RSS Feed
- Permalink
- Report Inappropriate Content
Sum of aggr() deos not return the expected array of values along the chosen dimension
Hello,
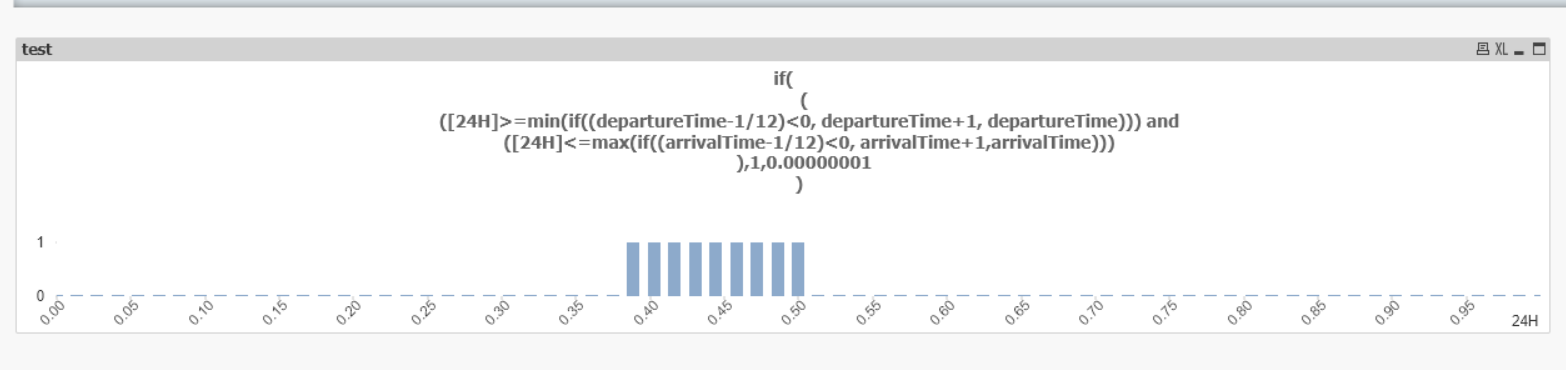
I have the following expression that gives me in a bar chart the time span of an activity (train run) as an array of ~0 and 1 over 24H (each 10 minutes) for a selected day. This expression works fine for a single train.
if(
(
([24H]>=min(if((departureTime-1/12)<0, departureTime+1, departureTime))) and
([24H]<=max(if((arrivalTime-1/12)<0, arrivalTime+1,arrivalTime)))
),1,0.00000001
)

If I tried to display the sum of the activities for all trains (trainNumber) using and aggr() by trainNumber and then a sum I do not get the expected result but it seems to be a single value.
sum(aggr(
if(
(
([24H]>=min(if((departureTime-1/12)<0, departureTime+1, departureTime))) and
([24H]<=max(if((arrivalTime-1/12)<0, arrivalTime+1,arrivalTime)))
),1,0.00000001
),trainNumber)
)
Has anybody a clue why the expression does return an array of value along the dimension 24H and how I could get the expected results (a sum over all trainNumber of the chart shown for a single train in attached picture).
Thanks in advance and best regards
Pierre