Unlock a world of possibilities! Login now and discover the exclusive benefits awaiting you.
Announcements
Only at Qlik Connect! Guest keynote Jesse Cole shares his secrets for daring to be different. Learn More!
- Qlik Community
- :
- All Forums
- :
- QlikView App Dev
- :
- Sum of minimums in a chart or pivot table but calc...
Options
- Subscribe to RSS Feed
- Mark Topic as New
- Mark Topic as Read
- Float this Topic for Current User
- Bookmark
- Subscribe
- Mute
- Printer Friendly Page
Turn on suggestions
Auto-suggest helps you quickly narrow down your search results by suggesting possible matches as you type.
Showing results for
Not applicable
2013-12-04
07:33 AM
- Mark as New
- Bookmark
- Subscribe
- Mute
- Subscribe to RSS Feed
- Permalink
- Report Inappropriate Content
Sum of minimums in a chart or pivot table but calculated over expressions and not fields
Hello,
Please, I've been trying to solve this problem for a couple of day without success, so I decided to post my discussion to the community and hopefully find a way to solve it.
Objective:
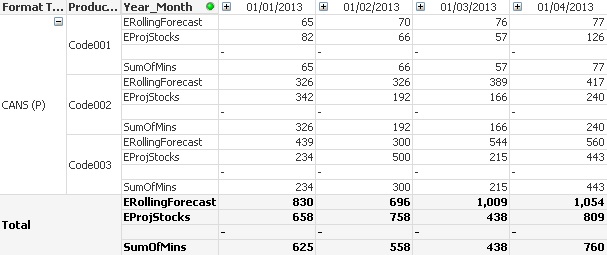
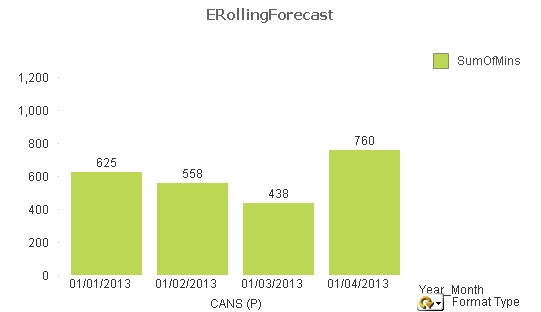
- - My end goal is to plot a bar-chart of the sum of the minimum values (per Product_Code, in a given Month) and be able to drill-up and down by Format Type and Product_Code. The minimums should be calculated based on two complex expression calculated previously (ERollingForecast and EProjectStocks)
- Example in January, Min(65,85) + Min(326,342) + Min(439, 234) = 65 + 326 + 234 = 625
The problem:
- So far, I am only able to achieve what I want when using a field instead of an expression. My problem is that in my dashboard the expressions EProjStocks and ERollingForecast are complex expressions that cannot be calculated at script level because they depend on user selections in the front-end.
- How can I achieve the same result but doing the calculations on the expressions, rather than on the fields?
- Sum of mins was defined like this (ProjStocks and RollingForecast are in these cases fields)
sum(aggr(rangemin(ProjStocks, RollingForecast), Product_Code, Year_Month, Format Type], Year_Week ) )
Thank you
398 Views
0 Replies