Unlock a world of possibilities! Login now and discover the exclusive benefits awaiting you.
- Qlik Community
- :
- All Forums
- :
- QlikView App Dev
- :
- Sum of ranked Top N Values , not working in all ca...
- Subscribe to RSS Feed
- Mark Topic as New
- Mark Topic as Read
- Float this Topic for Current User
- Bookmark
- Subscribe
- Mute
- Printer Friendly Page
- Mark as New
- Bookmark
- Subscribe
- Mute
- Subscribe to RSS Feed
- Permalink
- Report Inappropriate Content
Sum of ranked Top N Values , not working in all cases
Dear Community members,
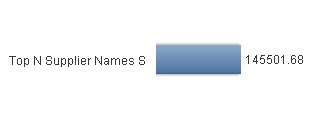
I trying to calculate the sum of the ( Top N suppliers in my graph). I want to have single bar for top N suppliers showing their total sum.
(These table and graphs are using sample data as i can not share the actual data, sorry company policy.)
I am using the formula below to generate the graphs with single bar:
Formula:
sum
(
if(
aggr(rank(sum(if(Currency_Table_1='EUR',[Invoice Amt Fnc],[Invoice Amt Fnc]*[YEAR 2014]))),[Supplier Name])>9,
0,
aggr(sum(if(Currency_Table_1='EUR',[Invoice Amt Fnc],[Invoice Amt Fnc]*[YEAR 2014])),[Supplier Name]))
)
Problem Area:
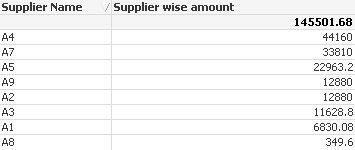
This formula works fine as long as there are unique values in the 'Supplier wise Amount' or in 'Supplier Name'
But in case
When there is a Repeat value in the 'Supplier wise Amount' or in 'Supplier Name', the above formula shows wrong total.
Please help !
i am also attaching the my QVW file and excel file ...in case if you need to analyse.
Thanks
Ashish Koul
- Tags:
- new_to_qlikview