Unlock a world of possibilities! Login now and discover the exclusive benefits awaiting you.
- Qlik Community
- :
- All Forums
- :
- QlikView App Dev
- :
- Switch Expression dimension
- Subscribe to RSS Feed
- Mark Topic as New
- Mark Topic as Read
- Float this Topic for Current User
- Bookmark
- Subscribe
- Mute
- Printer Friendly Page
- Mark as New
- Bookmark
- Subscribe
- Mute
- Subscribe to RSS Feed
- Permalink
- Report Inappropriate Content
Switch Expression dimension
Hi,
I have a question,
I have a bar chart like this:
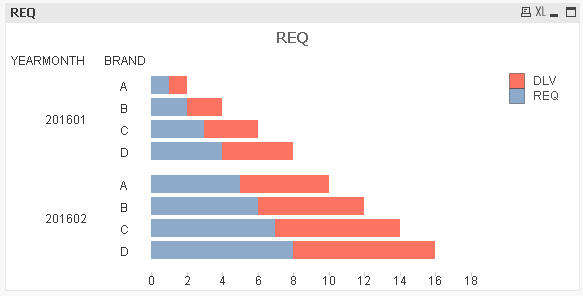
Is it possible for me to switch the position between BRAND and MY EXPRESSION (DLV & REQ) ?
I also attach my data and sample file.
Really appreciate your help
thanks in advance.
Accepted Solutions
- Mark as New
- Bookmark
- Subscribe
- Mute
- Subscribe to RSS Feed
- Permalink
- Report Inappropriate Content
This?
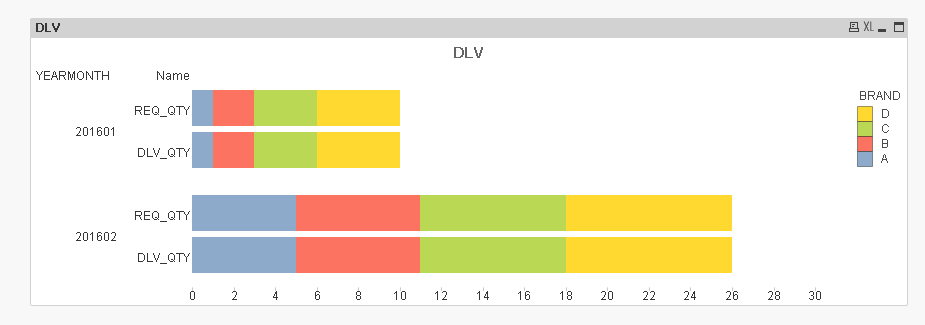
Script:
CrossTable (Name, Value, 2)
LOAD YEARMONTH,
BRAND,
REQ_QTY,
DLV_QTY
FROM
sample.xlsx
(ooxml, embedded labels, table is Sheet2);
Three Dimensions
YEARMONTH
Name
BRAND
Expression
Sum(Value)
- Mark as New
- Bookmark
- Subscribe
- Mute
- Subscribe to RSS Feed
- Permalink
- Report Inappropriate Content
What is meant by
switch the position between BRAND and MY EXPRESSION (DLV & REQ) ?
Please elaborate !
- Mark as New
- Bookmark
- Subscribe
- Mute
- Subscribe to RSS Feed
- Permalink
- Report Inappropriate Content
This?
Script:
CrossTable (Name, Value, 2)
LOAD YEARMONTH,
BRAND,
REQ_QTY,
DLV_QTY
FROM
sample.xlsx
(ooxml, embedded labels, table is Sheet2);
Three Dimensions
YEARMONTH
Name
BRAND
Expression
Sum(Value)
- Mark as New
- Bookmark
- Subscribe
- Mute
- Subscribe to RSS Feed
- Permalink
- Report Inappropriate Content
possible if you have a record for Requested quantity and a record for Delivered quantity then next to each record you would put Flag as R or V
in this way you would use the Flag as a dimension
and you need to add the Brand as a dimension too
in your expression you would count the brands (how many times a brand was ordered or delivered)
is this what you aim for?
- Mark as New
- Bookmark
- Subscribe
- Mute
- Subscribe to RSS Feed
- Permalink
- Report Inappropriate Content
Yes that's my goal.
Thanks once again ! Really appreciate your help