Unlock a world of possibilities! Login now and discover the exclusive benefits awaiting you.
- Qlik Community
- :
- All Forums
- :
- QlikView App Dev
- :
- Table Adding Unexpected Rows using Set Analysis
- Subscribe to RSS Feed
- Mark Topic as New
- Mark Topic as Read
- Float this Topic for Current User
- Bookmark
- Subscribe
- Mute
- Printer Friendly Page
- Mark as New
- Bookmark
- Subscribe
- Mute
- Subscribe to RSS Feed
- Permalink
- Report Inappropriate Content
Table Adding Unexpected Rows using Set Analysis
Hello,
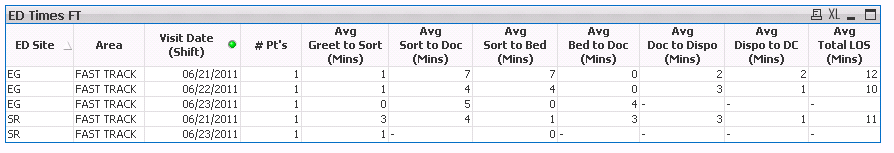
The first table below appears to be calculating correctly. It has 3 dimensions (Site, Area, Date). The remaining columns are expressions that use set analysis to select the way we want the dimensions to display.
Example: avg({<CARE_AREA={'FAST TRACK'}, ED_VISIT_SHIFT_DATE= {">=$(=date(Past7Days)) <=$(=date(ED_VISIT_SHIFT_DATE))"}>}ARRIVAL_TO_TRIAGE_END_MINS)
Notice that I am specifically selecting fast track and patients within a 7 day range.
The problem occurs in the second table when I add in a YTD column.
Example: avg({$<ED_VISIT_SHIFT_DATE= {">=$(=date(CalendarYearStart)) <=$(=date(ED_VISIT_SHIFT_DATE))"}, CARE_AREA={'FAST TRACK'} >} ARRIVAL_TO_ED_EXIT_MINS)
It is selecting the average LOS from Calendar year start through current date. It is adding a new row instead of keeping my date selections from table one and giving me the appropriate YTD average for only the dates specified in the other expressions.
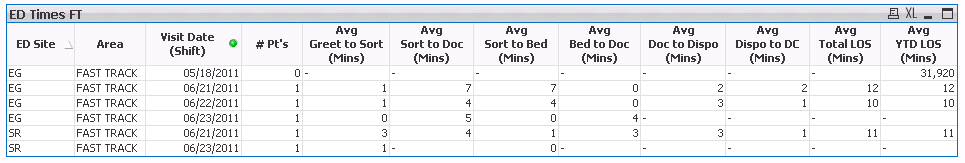
How can I show my year to date number without adding new rows to the table?
Thanks,
Scott