Unlock a world of possibilities! Login now and discover the exclusive benefits awaiting you.
- Qlik Community
- :
- All Forums
- :
- QlikView App Dev
- :
- Re: Table Box Aggregation (Max) Single Line of Dat...
- Subscribe to RSS Feed
- Mark Topic as New
- Mark Topic as Read
- Float this Topic for Current User
- Bookmark
- Subscribe
- Mute
- Printer Friendly Page
- Mark as New
- Bookmark
- Subscribe
- Mute
- Subscribe to RSS Feed
- Permalink
- Report Inappropriate Content
Table Box Aggregation (Max) Single Line of Data
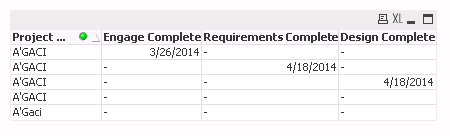
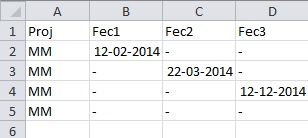
I have coded my LOAD script to pull a date when a task name is matched and I want to present each task date per project on a single row within a table (see below). I have done this in a report, outside of QlikView using the max aggregation, but I cannot get to this work in QV.
I would like the table to have one row for the project name and each date value listed in the same row.
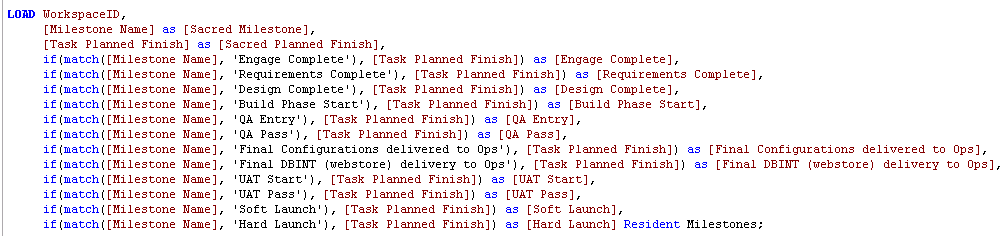
Script:
- « Previous Replies
-
- 1
- 2
- Next Replies »
- Mark as New
- Bookmark
- Subscribe
- Mute
- Subscribe to RSS Feed
- Permalink
- Report Inappropriate Content
Hi,
Can You tell us,
What is your dimension?
and
What is your expressions?
Regards,
Please appreciate our Qlik community members by giving Kudos for sharing their time for your query. If your query is answered, please mark the topic as resolved 🙂
- Mark as New
- Bookmark
- Subscribe
- Mute
- Subscribe to RSS Feed
- Permalink
- Report Inappropriate Content
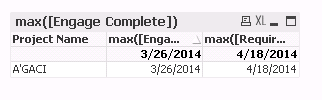
I was able to get it to work, can i remove the grand totals row now?
- Mark as New
- Bookmark
- Subscribe
- Mute
- Subscribe to RSS Feed
- Permalink
- Report Inappropriate Content
Hi,
Yes,
Just Select No Total Instead of Expression Totals
In Expression Tab
Regards,
Please appreciate our Qlik community members by giving Kudos for sharing their time for your query. If your query is answered, please mark the topic as resolved 🙂
- Mark as New
- Bookmark
- Subscribe
- Mute
- Subscribe to RSS Feed
- Permalink
- Report Inappropriate Content
Dear,
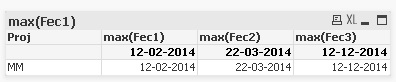
I make an example and it work fine!
I send you my files and printscreen. I hope this helps you
Regards
- « Previous Replies
-
- 1
- 2
- Next Replies »