Unlock a world of possibilities! Login now and discover the exclusive benefits awaiting you.
- Qlik Community
- :
- All Forums
- :
- QlikView App Dev
- :
- Table / Pivot table sum
- Subscribe to RSS Feed
- Mark Topic as New
- Mark Topic as Read
- Float this Topic for Current User
- Bookmark
- Subscribe
- Mute
- Printer Friendly Page
- Mark as New
- Bookmark
- Subscribe
- Mute
- Subscribe to RSS Feed
- Permalink
- Report Inappropriate Content
Table / Pivot table sum
Hi everybody.
I have a straight table like this, total mode is set to "Expression Total":
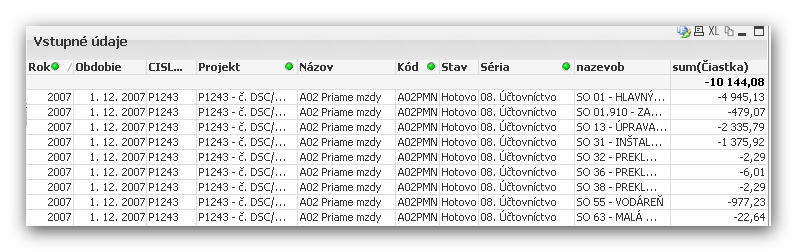
As you can see (or calculate), the total value isn't correct, the correct value is -10 146,37.
The difference is exact 2,29, that means, that the "Expression Total" setting causes "distinct sum", e.g. the doubled value 2,29 is summed only once.
I can repair this behaviour by total mode setting to "Sum of Rows":
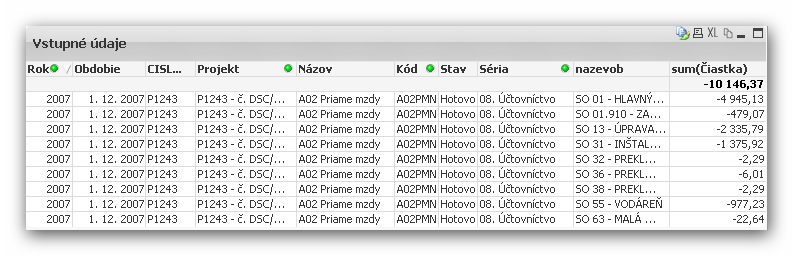
Until now OK 🙂
But in another pivot table I'm using a calculated dimension ...
sum({$<Séria ={'08. Účtovníctvo'}>}Čiastka)
... and the result is afflicted by missing of such doubled values.
The bad thing is, that in the pivot table I'm not able to set the total mode to "Sum of rows" 😞
What can I do ?
Thanx in advance.
Duski
- Tags:
- new_to_qlikview
Accepted Solutions
- Mark as New
- Bookmark
- Subscribe
- Mute
- Subscribe to RSS Feed
- Permalink
- Report Inappropriate Content
I think we are moving away from the original reason for this post, but the reason those two sum(aggr()) expressions are behaving that way is that the selection is being applied to the outer sum. You could override the selection on the outer sum in the same way as the inner sum:
=sum({$<Séria ={'01. Orientacný plán'}>} aggr(sum({$<Séria ={'01. Orientacný plán'}>}Ciastka),CISLOSTAVBY,Projekt,nazevob,Názov,Kód,Obdobie,Rok,Stav, Séria))
Also the list of dimensions in the aggr must include all the dimensions in the chart - its not clear whether that is the case.
HTH
Jonathan
- Mark as New
- Bookmark
- Subscribe
- Mute
- Subscribe to RSS Feed
- Permalink
- Report Inappropriate Content
Hi
Are you sure that the expression total is wrong? Normally, its the more correct of the two and it does not distinct the values unless that is in your expression.
If the expression is simply Sum(Ciastka), then I think that the 2.29 is genuinely duplicated and your table and the sum of rows is double counting it. Perhaps on of the the dimensions is not properly associated with the fact table causing the value to appear twice. You will need to validate the numbers against the source data to verify this.
HTH
Jonathan
- Mark as New
- Bookmark
- Subscribe
- Mute
- Subscribe to RSS Feed
- Permalink
- Report Inappropriate Content
Hi, Johanthan
thank you for you answer.
The double value -2,29 is correct (it comes from the underlying dataset) and I want it to be summed.
As you can see, there is a difference between this two records in field "nazevob"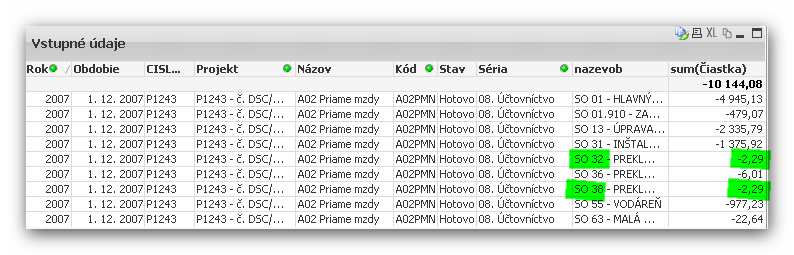
Any suggestions ?
Thanx in advance.
Duski
- Mark as New
- Bookmark
- Subscribe
- Mute
- Subscribe to RSS Feed
- Permalink
- Report Inappropriate Content
Hi Dusan,
Please use the rowno() function in the Script when you are loading the Fact Data.
Load *,Rowno() as RecordNo
.....
It will helps you easy to find out the duplicate records and Also helps you the get the correct Sum() of records.
Thanks
Sovan
- Mark as New
- Bookmark
- Subscribe
- Mute
- Subscribe to RSS Feed
- Permalink
- Report Inappropriate Content
hi try this
sum(aggr(sum(Čiastka),Dimension1,Dimension2,Dimension3,Dimension4,Dimension5,Dimension6,Dimension7,Dimension8,Dimension9))
- Mark as New
- Bookmark
- Subscribe
- Mute
- Subscribe to RSS Feed
- Permalink
- Report Inappropriate Content
Hi, Prem.
Thank you for you answer.
The sum(aggr(sum(Čiastka), Dimensions .....) I already tried, but this doesn't work correct for me.
Lets me explain the situation a little bit more detailed.
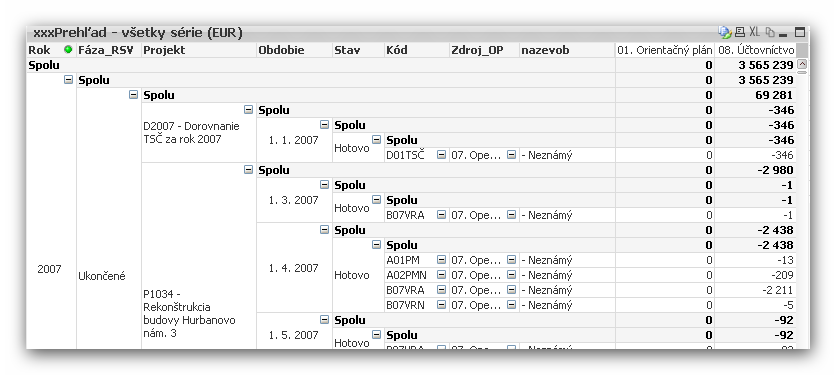
My pivot table in fact looks like this:
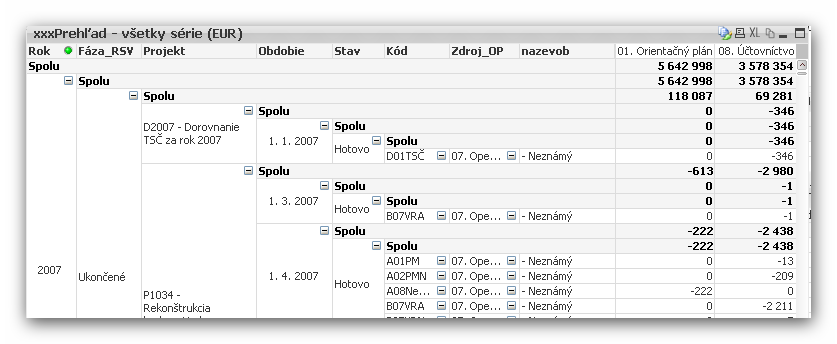
As you can see, I have two calculated expressions:
01. Orientačný plán = sum({$<Séria ={'01. Orientačný plán'}>}Čiastka)
08. Účtovníctvo = sum({$<Séria ={'08. Účtovníctvo'}>}Čiastka)
They sum values "Čiastka" from the whole dataset according to current selection ($) and where the value in field Séria equals '01. Orientačný plán' or '08. Účtovníctvo'.
As you can see, there are some values in BOTH columns of the pivot table - and that's I want.
(With exception, that the sum's don't contain anyhow duplicated values - that's the discussed problem.)
And, that's important, THE RESULTS ARE INDEPENDENT FROM THE CURRENT SELECTION IN FIELD "Séria" !!!
If I extend my expressions this way ...
01. Orientačný plán = sum(aggr(sum({$<Séria ={'01. Orientačný plán'}>}Čiastka),CISLOSTAVBY,Projekt,nazevob,Názov,Kód,Obdobie,Rok,Stav, Séria))
08. Účtovníctvo = sum(aggr(sum({$<Séria ={'08. Účtovníctvo'}>}Čiastka),CISLOSTAVBY,Projekt,nazevob,Názov,Kód,Obdobie,Rok,Stav,Séria))
...summed data are correct (doubled values are included), but the columns contain data ONLY in the apropriate column according to selection is field "Séria":-(
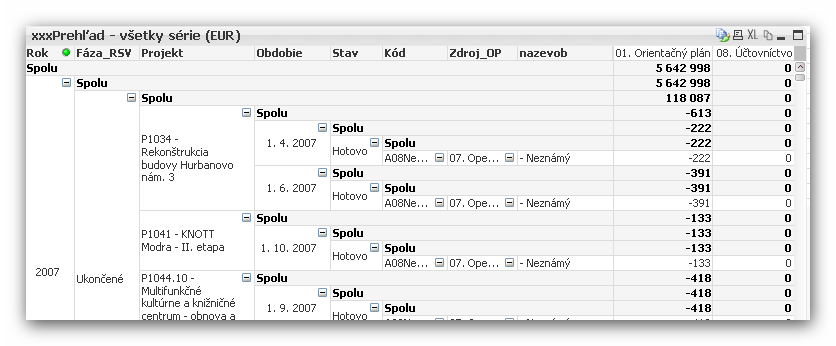
And this is useless form me, because the goal of my pivot table is to compare values in both columns 😞
Any suggestion ?
Thanx in advance.
Duski
- Mark as New
- Bookmark
- Subscribe
- Mute
- Subscribe to RSS Feed
- Permalink
- Report Inappropriate Content
I think we are moving away from the original reason for this post, but the reason those two sum(aggr()) expressions are behaving that way is that the selection is being applied to the outer sum. You could override the selection on the outer sum in the same way as the inner sum:
=sum({$<Séria ={'01. Orientacný plán'}>} aggr(sum({$<Séria ={'01. Orientacný plán'}>}Ciastka),CISLOSTAVBY,Projekt,nazevob,Názov,Kód,Obdobie,Rok,Stav, Séria))
Also the list of dimensions in the aggr must include all the dimensions in the chart - its not clear whether that is the case.
HTH
Jonathan
- Mark as New
- Bookmark
- Subscribe
- Mute
- Subscribe to RSS Feed
- Permalink
- Report Inappropriate Content
Hi, Jonathan,
you are the winner !!! It works !!!
Thank you very much !!!
But I must admit, that I can't really understand, how your statement works :-(((
Regards
Duski