Unlock a world of possibilities! Login now and discover the exclusive benefits awaiting you.
Announcements
Join us to spark ideas for how to put the latest capabilities into action. Register here!
- Qlik Community
- :
- All Forums
- :
- QlikView App Dev
- :
- Table distribution in QV
Options
- Subscribe to RSS Feed
- Mark Topic as New
- Mark Topic as Read
- Float this Topic for Current User
- Bookmark
- Subscribe
- Mute
- Printer Friendly Page
Turn on suggestions
Auto-suggest helps you quickly narrow down your search results by suggesting possible matches as you type.
Showing results for
Not applicable
2014-04-10
03:21 AM
- Mark as New
- Bookmark
- Subscribe
- Mute
- Subscribe to RSS Feed
- Permalink
- Report Inappropriate Content
Table distribution in QV
Hi, I have a table shown as below.
| year | Product | Sale |
|---|---|---|
| 2011 | A | Percentile(A,0.5) |
| 2011 | B | Percentile(B,0.5) |
| 2011 | C | Percentile(C,0.5) |
| 2009 | A | Percentile(A,0.5) |
| 2009 | B | Percentile(B,0.5) |
| 2009 | C | Percentile(C,0.5) |
| 2008 | A | Percentile(A,0.5) |
How can i switch it to the table shown like this?
| date | A | B | C |
|---|---|---|---|
| 2011 | Percentile(A,0.5) | Percentile(B,0.5) | Percentile(C,0.5) |
| 2009 | Percentile(A,0.5) | Percentile(B,0.5) | Percentile(C,0.5) |
| 2008 | Percentile(A,0.5) | Percentile(B,0.5) | Percentile(C,0.5) |
Thanks so much!
1,316 Views
- « Previous Replies
-
- 1
- 2
- Next Replies »
11 Replies
Not applicable
2014-04-20
09:18 PM
Author
- Mark as New
- Bookmark
- Subscribe
- Mute
- Subscribe to RSS Feed
- Permalink
- Report Inappropriate Content
Hi, another additional question need your help...
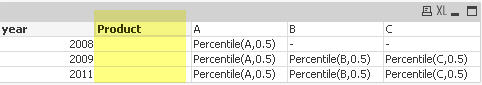
How could I remove the 'Product' column? Since I use the pivot table...
194 Views
Partner - Champion III
2014-04-21
03:40 AM
- Mark as New
- Bookmark
- Subscribe
- Mute
- Subscribe to RSS Feed
- Permalink
- Report Inappropriate Content
you cannot hide it because you have a pivot ... the only way is to delete it from dimension and for each expression use aggr( ....., Product)
194 Views
- « Previous Replies
-
- 1
- 2
- Next Replies »