Unlock a world of possibilities! Login now and discover the exclusive benefits awaiting you.
- Qlik Community
- :
- All Forums
- :
- QlikView App Dev
- :
- Table help
- Subscribe to RSS Feed
- Mark Topic as New
- Mark Topic as Read
- Float this Topic for Current User
- Bookmark
- Subscribe
- Mute
- Printer Friendly Page
- Mark as New
- Bookmark
- Subscribe
- Mute
- Subscribe to RSS Feed
- Permalink
- Report Inappropriate Content
Table help
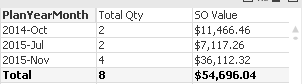
Hi guys! I need help creating a qlik table/chart. I'm currently getting this in my output:
But what I want to see is :
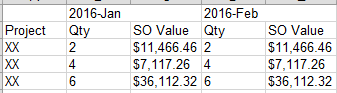
Is it possible to get this view in Qlik?
- Mark as New
- Bookmark
- Subscribe
- Mute
- Subscribe to RSS Feed
- Permalink
- Report Inappropriate Content
Use a pivot table and make sure pivoting is enabled (presentation tab). You should be able to drag your columns and rows to get the view that you want (and you'll need to add project as a dimension).
- Mark as New
- Bookmark
- Subscribe
- Mute
- Subscribe to RSS Feed
- Permalink
- Report Inappropriate Content
I double checked that Pivoting is enabled but its not letting me drag the plan Year/Month to a row. Any suggestion?
- Mark as New
- Bookmark
- Subscribe
- Mute
- Subscribe to RSS Feed
- Permalink
- Report Inappropriate Content
Update: Finally got it working. How can I tell the table to only display the value in this table if Qty>0?
- Mark as New
- Bookmark
- Subscribe
- Mute
- Subscribe to RSS Feed
- Permalink
- Report Inappropriate Content
Yes, Pivot table is the way to go as Nicole suggested. But how exactly will it work is difficult to suggest without looking at the data structure and the expressions. Would you be able to provide a sample?
- Mark as New
- Bookmark
- Subscribe
- Mute
- Subscribe to RSS Feed
- Permalink
- Report Inappropriate Content
You can check the option to 'Suppress Zero Values' on the presentation tab
- Mark as New
- Bookmark
- Subscribe
- Mute
- Subscribe to RSS Feed
- Permalink
- Report Inappropriate Content
Thank you for your response. I now have the pivot table layout fixed but it still is not Suppressing Zero Values even though the option has been selected. What could I be doing wrong?
- Mark as New
- Bookmark
- Subscribe
- Mute
- Subscribe to RSS Feed
- Permalink
- Report Inappropriate Content
Would you be able to share a snapshot of what you are seeing?