Unlock a world of possibilities! Login now and discover the exclusive benefits awaiting you.
- Qlik Community
- :
- All Forums
- :
- QlikView App Dev
- :
- Table help
- Subscribe to RSS Feed
- Mark Topic as New
- Mark Topic as Read
- Float this Topic for Current User
- Bookmark
- Subscribe
- Mute
- Printer Friendly Page
- Mark as New
- Bookmark
- Subscribe
- Mute
- Subscribe to RSS Feed
- Permalink
- Report Inappropriate Content
Table help
Hello,
Looking for help creating almost a crosstable with no dimensions. I know how to create it with lines and text objects, but I didn't know if there was another way. Here is a picture of what I am trying to create :
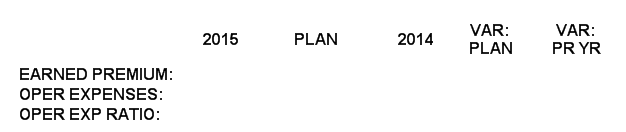
I am looking to fill in data for each item on the right, by year initially and then by the variance to 2015 for plan and finally prior year. Any suggestions since we are not using a true dimension anywhere?
Thank you, just looking for an easier way if possible,
Justin
- Tags:
- new_to_qlikview
- table
Accepted Solutions
- Mark as New
- Bookmark
- Subscribe
- Mute
- Subscribe to RSS Feed
- Permalink
- Report Inappropriate Content
I don't think that will take more resources then the text objects. You can also use
=ValueList('Earned Premium','Oper expenses','Oper ratio')
As calculated dimension and use 5 expressions for the columns
- Mark as New
- Bookmark
- Subscribe
- Mute
- Subscribe to RSS Feed
- Permalink
- Report Inappropriate Content
You can include a calculated dimension like
=ValueList('2015','PLAN','2014','Var:PLAN','VAR: PR YR')
In your expression you can reference the dimension by repeating this expression to do different calculations e.g.
If(ValueList('2015','PLAN','2014','Var:PLAN','VAR: PR YR')='2015',Sum({<Year={'2015'}>} Sales),
if(....
- Mark as New
- Bookmark
- Subscribe
- Mute
- Subscribe to RSS Feed
- Permalink
- Report Inappropriate Content
Thank you for the suggestion, would that use more resources than creating the text objects? Just seems like a lot of if statements if I am using 3 rows and 5 columns. Also, how would I cover each row? Using dimensionality of 1,2,3?
Thank you for the help,
Justin
- Mark as New
- Bookmark
- Subscribe
- Mute
- Subscribe to RSS Feed
- Permalink
- Report Inappropriate Content
I don't think that will take more resources then the text objects. You can also use
=ValueList('Earned Premium','Oper expenses','Oper ratio')
As calculated dimension and use 5 expressions for the columns
- Mark as New
- Bookmark
- Subscribe
- Mute
- Subscribe to RSS Feed
- Permalink
- Report Inappropriate Content
Awesome thank you for the help!
Justin