Unlock a world of possibilities! Login now and discover the exclusive benefits awaiting you.
- Qlik Community
- :
- All Forums
- :
- QlikView App Dev
- :
- Table report
- Subscribe to RSS Feed
- Mark Topic as New
- Mark Topic as Read
- Float this Topic for Current User
- Bookmark
- Subscribe
- Mute
- Printer Friendly Page
- Mark as New
- Bookmark
- Subscribe
- Mute
- Subscribe to RSS Feed
- Permalink
- Report Inappropriate Content
Table report
Hello,
I'm trying assess whether QV is appropriate for a major project without having laid eyes on it before last week.
After reading through some documentation, I'm trying to put together my first analysis object, and failing miserably.
Any advice would be greatly appreciated.
The object I'm trying to put together is supposed to compare the product set and product values between the current state of things (Reality) and a set of simulations like so:
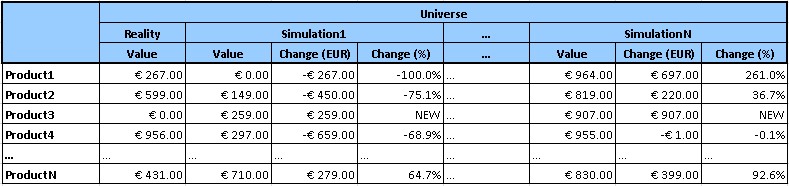
It has the Universe dimension across the top, the Product dimension down the side, and three expressions.
I've put together a pivot table that looks nearly like this, however it has two fatal shortcomings:
- I need the user to be able to easily sort on any column they like (preferably by double clicking on the heading)
- I need the "reality" universe to exclude the two "change" expressions, since it doesn't make sense to display the change of reality versus itself
As far as I can tell, pivot tables don't allow easy sorting, and straight tables don't allow dimensions across the top. If true, that means I'm in a pickle.
Any advice?