Unlock a world of possibilities! Login now and discover the exclusive benefits awaiting you.
- Qlik Community
- :
- All Forums
- :
- QlikView App Dev
- :
- Table with 2 lines just on total (Dimensionality()...
- Subscribe to RSS Feed
- Mark Topic as New
- Mark Topic as Read
- Float this Topic for Current User
- Bookmark
- Subscribe
- Mute
- Printer Friendly Page
- Mark as New
- Bookmark
- Subscribe
- Mute
- Subscribe to RSS Feed
- Permalink
- Report Inappropriate Content
Table with 2 lines just on total (Dimensionality()=0)
I need a help
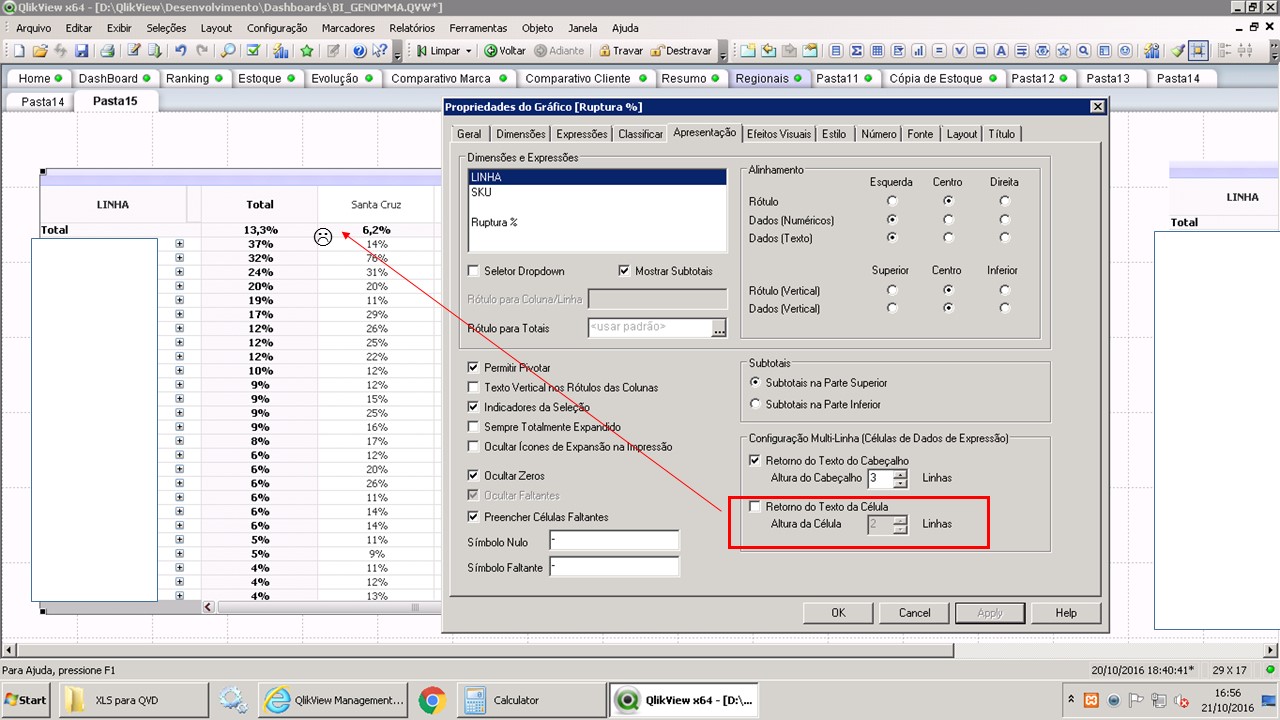
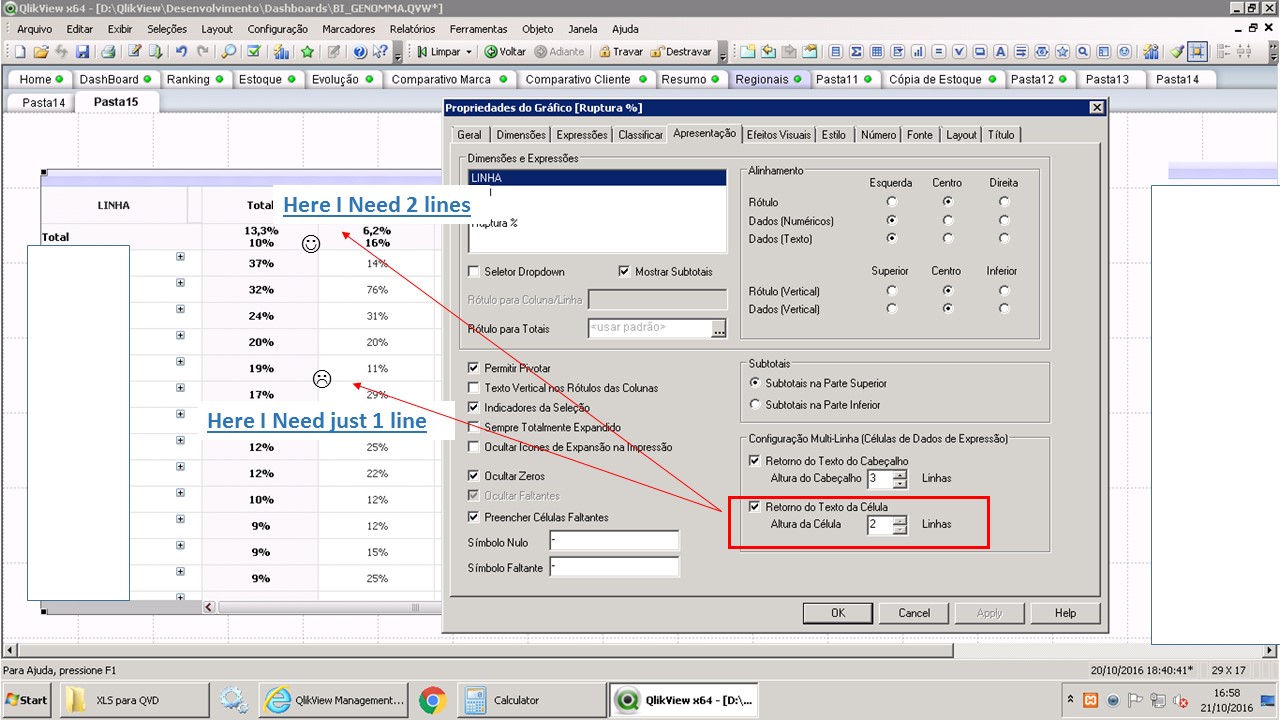
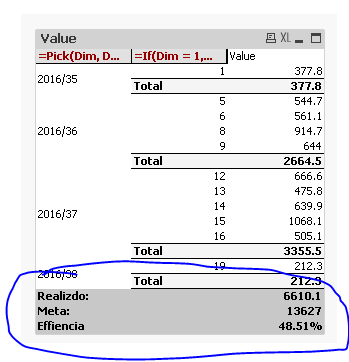
I created a table with an expression, this table would require 2 total, but as I could not solve this issue, one of a DUAL in IF (dimensionality () = 0) with CHR (13) so that the two totals that must stay in 2 lines. OK, but I'm not getting the TOTAL (dimensionality () = 0) is 2 lines and other expression with 1 only. Using the chart properties, can only all or nothing.

tksssss
- Mark as New
- Bookmark
- Subscribe
- Mute
- Subscribe to RSS Feed
- Permalink
- Report Inappropriate Content
No need for a sorry, I might be wrong here. But as long as the thread is open, we won't know for sure. So, I request the OP to close the thread by marking the correct response or provide more details if the problem is still not resolved.
Best,
Sunny
- Mark as New
- Bookmark
- Subscribe
- Mute
- Subscribe to RSS Feed
- Permalink
- Report Inappropriate Content
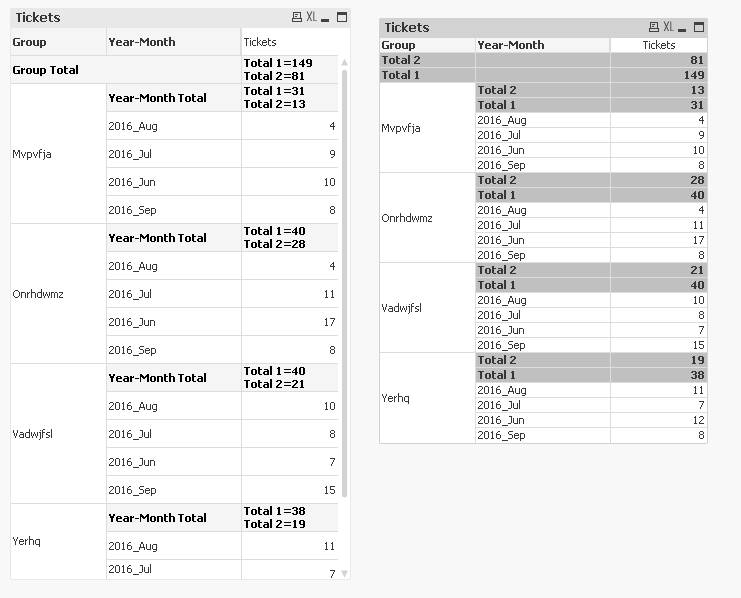
Let me try to explain the above expression,
You said you want to display two total values. Assume them as Total1 and Total2.
For Group (In my example) Total Dimensionality is Zero. So I can written a conditional statement like
If(Dimensionality()=0,'Total1='& Total1’s Exp & Chr(13) & 'Total2=' & Total2’s Exp,
You will have to write a expression in Total1's Exp place and separate expression for Total2 in Total2's Exp place.
For Year - Month Total Dimensionality is One. So I written a conditional statement like,
If(Dimensionality()=1,'Total1='& Total1’s Exp & Chr(13) & 'Total2=' & Total2’s Exp,
Please let me know if I am not clear.
Regards
Harish
- Mark as New
- Bookmark
- Subscribe
- Mute
- Subscribe to RSS Feed
- Permalink
- Report Inappropriate Content
Sorry I am not clear with the above question.
Are you telling you are not able to display the two totals in two different line?
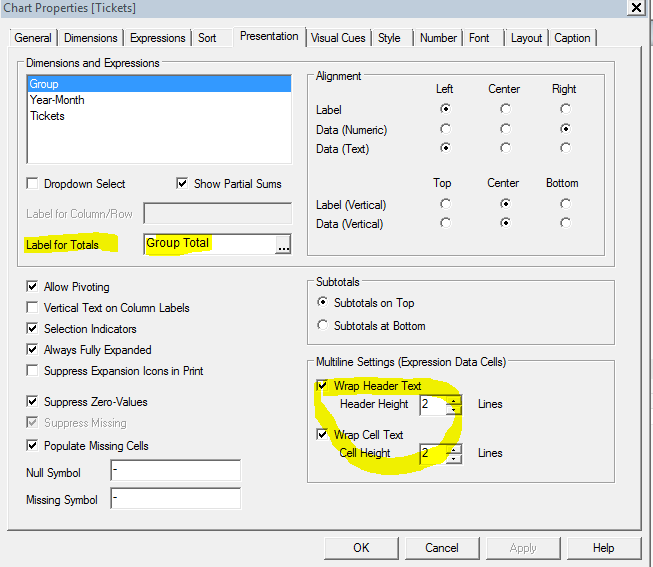
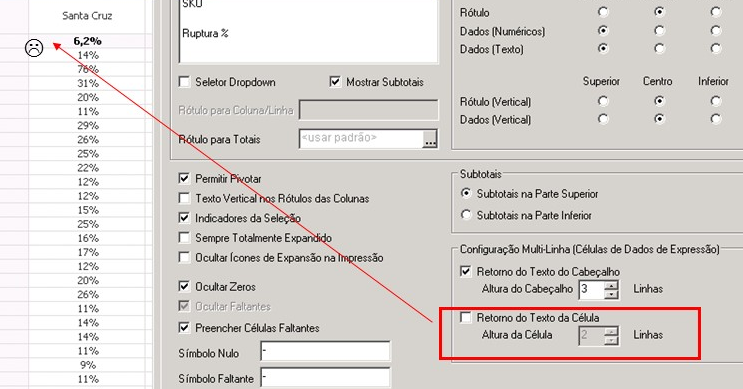
Can you make sure you have the following settings in the Presentation tab,
Regards
Harish
- Mark as New
- Bookmark
- Subscribe
- Mute
- Subscribe to RSS Feed
- Permalink
- Report Inappropriate Content
If you can share you dashboard and image of your expected output it will be very helpful.
Regards
Harish
- Mark as New
- Bookmark
- Subscribe
- Mute
- Subscribe to RSS Feed
- Permalink
- Report Inappropriate Content
From what I understood, the OP wanted two rows for Total, but a single row for the non-total rows. Something like how maico.sandri shared in the link here Total 3 Line in the PivotTable. I might be wrong, but that's how I interpreted the requirement 
- Mark as New
- Bookmark
- Subscribe
- Mute
- Subscribe to RSS Feed
- Permalink
- Report Inappropriate Content
This one shows three totals for the grand total
But in this thread, OP might be looking for 2 rows for each of the sub-totals
- Mark as New
- Bookmark
- Subscribe
- Mute
- Subscribe to RSS Feed
- Permalink
- Report Inappropriate Content
I agree Sunny. In the example which I have shared only the Totals have two values and the non - totals have single value only.
Regards
Harish
- Mark as New
- Bookmark
- Subscribe
- Mute
- Subscribe to RSS Feed
- Permalink
- Report Inappropriate Content
They do have single value, but they are still taking double the space. Can you look at my response below. See how we have Header Height of 1 for each cell, yet we see 3 totals? I think that is what the OP is looking for.
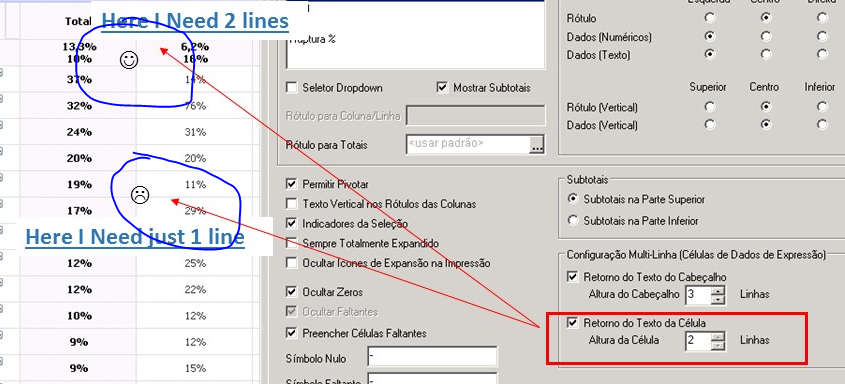
Unhappy with single row for sub-total when header-height is disabled. But when he enables it, he is happy with header height of 2 for the sub-total, but unhappy with the individual (non-total rows)
- Mark as New
- Bookmark
- Subscribe
- Mute
- Subscribe to RSS Feed
- Permalink
- Report Inappropriate Content
Got it!
Do you have any fix for this Sunny.
Regards
Harish
- Mark as New
- Bookmark
- Subscribe
- Mute
- Subscribe to RSS Feed
- Permalink
- Report Inappropriate Content
Using harishkumarg's sample, this is what I came up with... This can be further beautified, but I thought that lets just get O/Ps feedback before we make changes to this