Unlock a world of possibilities! Login now and discover the exclusive benefits awaiting you.
- Qlik Community
- :
- All Forums
- :
- QlikView App Dev
- :
- Table with calculated expression no longer filters...
- Subscribe to RSS Feed
- Mark Topic as New
- Mark Topic as Read
- Float this Topic for Current User
- Bookmark
- Subscribe
- Mute
- Printer Friendly Page
- Mark as New
- Bookmark
- Subscribe
- Mute
- Subscribe to RSS Feed
- Permalink
- Report Inappropriate Content
Table with calculated expression no longer filters to selections
Hi all - probably one of those easy questions to find the answer for if you know exactly what to ask, but I can't so here goes
I have a Straight Table as below (Company units are blanked). The June and July numbers are calculated expressions as
Sum ({<Month={"Jun"}>}[Sales])
Sum ({<Month={"Jul"}>}[Sales])
With the spark line expression
sum([Sales])
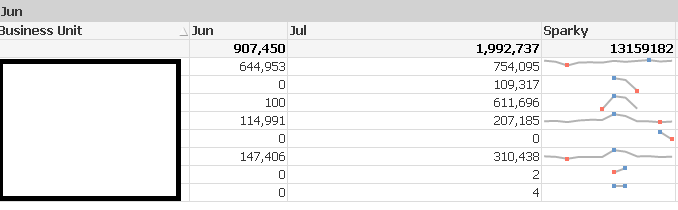
When I making any Business Unit selections anywhere such as a list box, the graph doesn't change to filter down to the BU selected. The Sparklines will disappear for all lines except the BU selected, but the remainder of the graph remains static as below
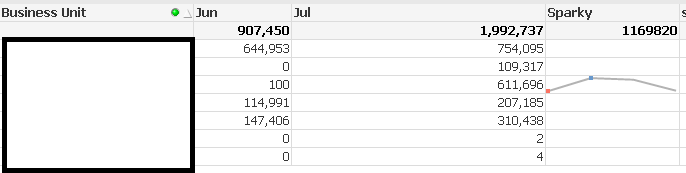
How do I program these expressions so they still filter if a user makes a BU drill down selection ?
- Tags:
- new_to_qlikview
- « Previous Replies
-
- 1
- 2
- Next Replies »
- Mark as New
- Bookmark
- Subscribe
- Mute
- Subscribe to RSS Feed
- Permalink
- Report Inappropriate Content
Can you re-check your expression and see if they have {1<Month... in the expression by chance?
- Mark as New
- Bookmark
- Subscribe
- Mute
- Subscribe to RSS Feed
- Permalink
- Report Inappropriate Content
Not sure what you mean - the expressions are exactly as above
- Mark as New
- Bookmark
- Subscribe
- Mute
- Subscribe to RSS Feed
- Permalink
- Report Inappropriate Content
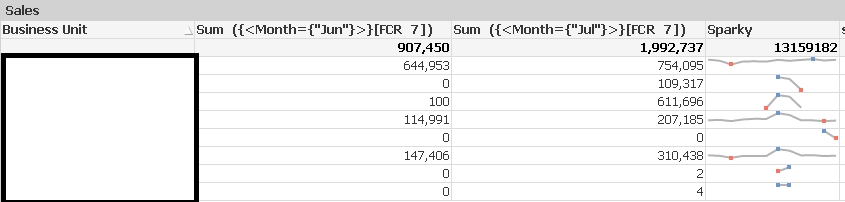
Can you remove expression labels (Jun, Jul) and repost a screenshot (Make sure the expressions are visible up top). The reason I ask for this is because I don't see any reason why it won't filter out on a selection.
- Mark as New
- Bookmark
- Subscribe
- Mute
- Subscribe to RSS Feed
- Permalink
- Report Inappropriate Content
As below (playing around with the raw data so FCR7 = Sales in the above expressions).
- Mark as New
- Bookmark
- Subscribe
- Mute
- Subscribe to RSS Feed
- Permalink
- Report Inappropriate Content
Don't see why it wouldn't work? Are you using Alternate States in your application?
- Mark as New
- Bookmark
- Subscribe
- Mute
- Subscribe to RSS Feed
- Permalink
- Report Inappropriate Content
Yes, but the selections and graph are set to the same state.
The Sparkline changes to only show the selections which would indicate to me that the Alt States are ok for the graph overall
- Mark as New
- Bookmark
- Subscribe
- Mute
- Subscribe to RSS Feed
- Permalink
- Report Inappropriate Content
I guess the only thing you can try is recreating the chart from scratch and see if it helps?
- Mark as New
- Bookmark
- Subscribe
- Mute
- Subscribe to RSS Feed
- Permalink
- Report Inappropriate Content
Ok - so my Alt States are 1 and 2.
The graph was Alt State 1 with the above issue. However when I change the Alt State to <Default State> it now works and filters as normal.
Note the above issue happened even when I clicked in the table itself.
My understanding about Alt States is that you could link certain selections to certain graphs and so on.
I don't understand why a single table would filter it's expressions that have no conditions, but not filter those that do.
- Mark as New
- Bookmark
- Subscribe
- Mute
- Subscribe to RSS Feed
- Permalink
- Report Inappropriate Content
Not sure I understand your question, Can you re-explain please?
- « Previous Replies
-
- 1
- 2
- Next Replies »