Unlock a world of possibilities! Login now and discover the exclusive benefits awaiting you.
- Qlik Community
- :
- All Forums
- :
- QlikView
- :
- Tabular Chart
- Subscribe to RSS Feed
- Mark Topic as New
- Mark Topic as Read
- Float this Topic for Current User
- Bookmark
- Subscribe
- Mute
- Printer Friendly Page
- Mark as New
- Bookmark
- Subscribe
- Mute
- Subscribe to RSS Feed
- Permalink
- Report Inappropriate Content
Tabular Chart
Hello All,
Can a following straight table chart be created in Qlikview ?
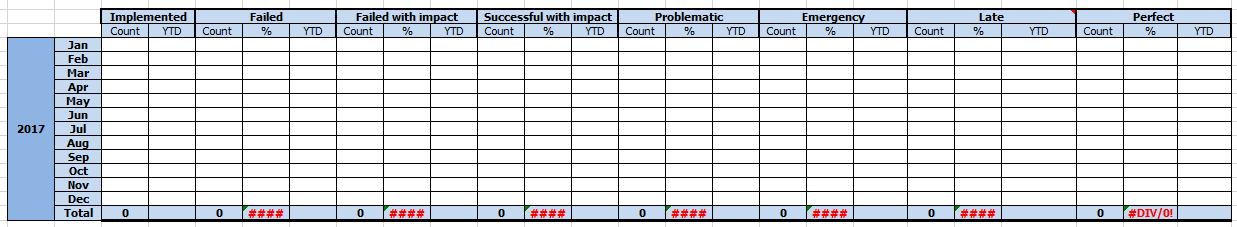
Specifically referring to the 12 months to be displayed vertically. If so, could you please explain how it can be achieved ?
Accepted Solutions
- Mark as New
- Bookmark
- Subscribe
- Mute
- Subscribe to RSS Feed
- Permalink
- Report Inappropriate Content
Have you tried pivot chart
- Mark as New
- Bookmark
- Subscribe
- Mute
- Subscribe to RSS Feed
- Permalink
- Report Inappropriate Content
Have you tried pivot chart
- Mark as New
- Bookmark
- Subscribe
- Mute
- Subscribe to RSS Feed
- Permalink
- Report Inappropriate Content
Yes, but I couldn't seem to understand how to get the month display to be vertical rather than horizontal
- Mark as New
- Bookmark
- Subscribe
- Mute
- Subscribe to RSS Feed
- Permalink
- Report Inappropriate Content
The pivot table will help. Have 3 dimensions, year,month, one for implemented etc and move the 3rd dimension horizontally.
- Mark as New
- Bookmark
- Subscribe
- Mute
- Subscribe to RSS Feed
- Permalink
- Report Inappropriate Content
You can create the Pivot table with Dimension Year, Month. Then create all the expression for Implemented, Failed, Failed with Impact etc.
Remove the caption of pivot table. You can put the text objects for captions Implemented, Failed, ...... just above the pivot table and adjust the width and height of text object with pivot table expression
- Mark as New
- Bookmark
- Subscribe
- Mute
- Subscribe to RSS Feed
- Permalink
- Report Inappropriate Content
Thanks for your reply Kushal. Is there any way I can remove the labels for the year and month showing up in the table?

- Mark as New
- Bookmark
- Subscribe
- Mute
- Subscribe to RSS Feed
- Permalink
- Report Inappropriate Content
Go to dimension tab, click on dimension, then put =' ' in dimension label