Unlock a world of possibilities! Login now and discover the exclusive benefits awaiting you.
- Qlik Community
- :
- All Forums
- :
- QlikView App Dev
- :
- Text Count and Line Charts
- Subscribe to RSS Feed
- Mark Topic as New
- Mark Topic as Read
- Float this Topic for Current User
- Bookmark
- Subscribe
- Mute
- Printer Friendly Page
- Mark as New
- Bookmark
- Subscribe
- Mute
- Subscribe to RSS Feed
- Permalink
- Report Inappropriate Content
Text Count and Line Charts
Hello Everyone,
I am fairly new to QlikView and have just ran in too a problem that i am having trouble resolving.
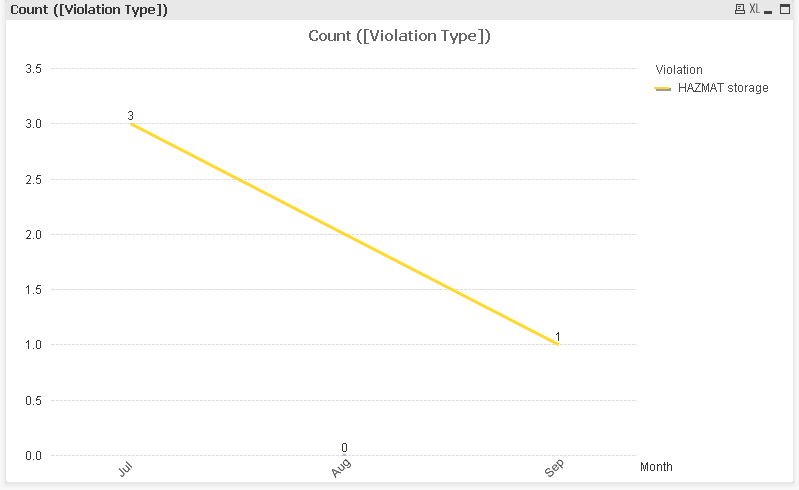
I am working on an app to display various safety violations on the course of a given time frame. The problem I am having is at certain points of time there are no violations reported creating a null value. I have tried to display the Null values as zeros but with limited success. When I select an individual violation type I see a zero point for the time frame but the line ignores it and proceeds to the next value, giving a false impression of a value in between. See the example below. Also these Null/Zero values do not display when multiple violations are selected. Does anyone know how to fix this?
- Tags:
- new_to_qlikview
- Mark as New
- Bookmark
- Subscribe
- Mute
- Subscribe to RSS Feed
- Permalink
- Report Inappropriate Content
If it is zero sure it will draw a line to it.
Can you post your expression. If possible sample file?
- Mark as New
- Bookmark
- Subscribe
- Mute
- Subscribe to RSS Feed
- Permalink
- Report Inappropriate Content
Maybe you have ticked the box to Suppress when value is null() ??
- Mark as New
- Bookmark
- Subscribe
- Mute
- Subscribe to RSS Feed
- Permalink
- Report Inappropriate Content
Hi,
Used this statement on the script.
Set NullValue = '0';
NULLASVALUE *;
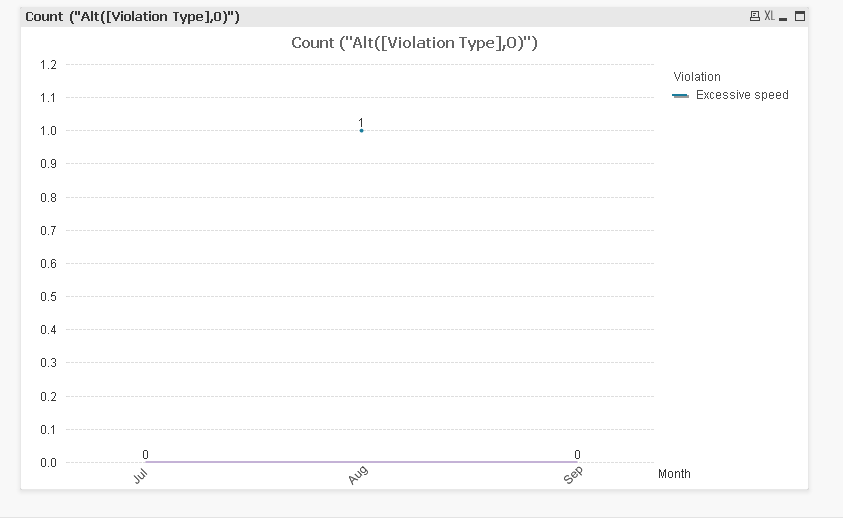
I used this expression on my line graph
Count ("Alt([Violation Type],0)")
- Mark as New
- Bookmark
- Subscribe
- Mute
- Subscribe to RSS Feed
- Permalink
- Report Inappropriate Content
No I had that unticked. I am able to see the nulls as zero when an individual selection is made, just not when multiple or all possible selections are displayed. The big issue is that the line ignores the zeros and proceeds to the next value.
- Mark as New
- Bookmark
- Subscribe
- Mute
- Subscribe to RSS Feed
- Permalink
- Report Inappropriate Content
I also tried this expression.
Count([Violation Type])
- Mark as New
- Bookmark
- Subscribe
- Mute
- Subscribe to RSS Feed
- Permalink
- Report Inappropriate Content
Upon further review I had discovered this abnormality. The line ignored the value and only plotted null/zero values.
- Mark as New
- Bookmark
- Subscribe
- Mute
- Subscribe to RSS Feed
- Permalink
- Report Inappropriate Content
Because of that only its treating zero as null.
- Mark as New
- Bookmark
- Subscribe
- Mute
- Subscribe to RSS Feed
- Permalink
- Report Inappropriate Content
I have resolved the issue. It had to due with the source file.