Unlock a world of possibilities! Login now and discover the exclusive benefits awaiting you.
- Qlik Community
- :
- All Forums
- :
- QlikView App Dev
- :
- Text on axis problem
- Subscribe to RSS Feed
- Mark Topic as New
- Mark Topic as Read
- Float this Topic for Current User
- Bookmark
- Subscribe
- Mute
- Printer Friendly Page
- Mark as New
- Bookmark
- Subscribe
- Mute
- Subscribe to RSS Feed
- Permalink
- Report Inappropriate Content
Text on axis problem
Hi all.
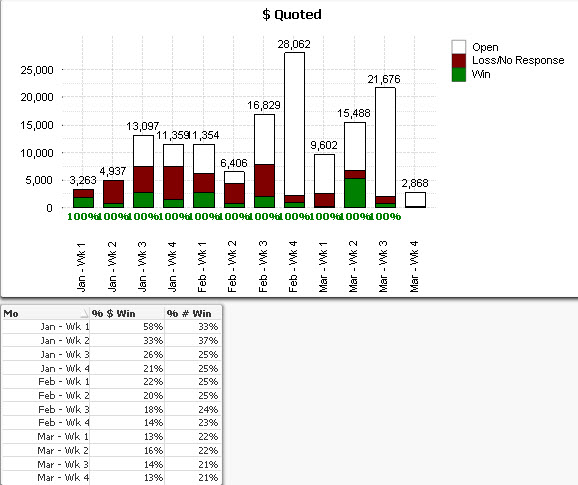
I am trying to get a running total % for a bar chart. But when I copy and paste the equation for the chart and just display "text on axis" it comes out as 100% but on the straight table it comes out as a percentage (see picture). The equation for the '% $ Win' is as follows:
RangeSum(Above(sum({<Year={$(vYearSelected)},Quoted_Status={'Win'}>}total_price), 0, RowNo()))
/RangeSum(Above(sum({<Year={$(vYearSelected)}>}total_price), 0, RowNo()))
How can I make this equation represent an accumulated total win per week divided by the accumulated total? then just have it displayed as "text on axis"
any input is appreciated.
thank you!

Accepted Solutions
- Mark as New
- Bookmark
- Subscribe
- Mute
- Subscribe to RSS Feed
- Permalink
- Report Inappropriate Content
Hi Jacob, I tried to recreate your problem but seems it's working for me, I just added a condition so values don't overlap (without that condition it will show a value for each segment of the bar)
Please take a look at the attached document to check where is the difference with your document.
- Mark as New
- Bookmark
- Subscribe
- Mute
- Subscribe to RSS Feed
- Permalink
- Report Inappropriate Content
Thank you.
- Mark as New
- Bookmark
- Subscribe
- Mute
- Subscribe to RSS Feed
- Permalink
- Report Inappropriate Content
Ruben,
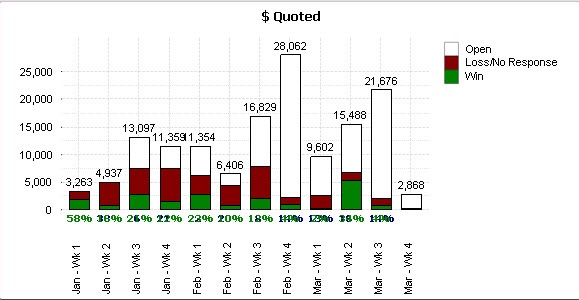
Thanks for the help earlier. Now I am trying to add the "% # Win" in blue underneath the other text on axis but they keep stacking see picture.
How can i fix this issue?
- Mark as New
- Bookmark
- Subscribe
- Mute
- Subscribe to RSS Feed
- Permalink
- Report Inappropriate Content
Hi Jacob, mine is showing underneath the other text, maybe we are doing it differently, to recreate my steps:
- added a new expression to calculate the %#
- ascended it to the 2nd expression
- removed the bar option
- checked to show as text on axis.
Hope this helps!
- Mark as New
- Bookmark
- Subscribe
- Mute
- Subscribe to RSS Feed
- Permalink
- Report Inappropriate Content
It works perfect when I do it offline, its when i publish it on the server it gets all wacky.
there might not be a fix to this?