Unlock a world of possibilities! Login now and discover the exclusive benefits awaiting you.
- Qlik Community
- :
- All Forums
- :
- QlikView App Dev
- :
- Time dimension in a chart - how to make this dime...
- Subscribe to RSS Feed
- Mark Topic as New
- Mark Topic as Read
- Float this Topic for Current User
- Bookmark
- Subscribe
- Mute
- Printer Friendly Page
- Mark as New
- Bookmark
- Subscribe
- Mute
- Subscribe to RSS Feed
- Permalink
- Report Inappropriate Content
Time dimension in a chart - how to make this dimensions respond to variables
Hi all
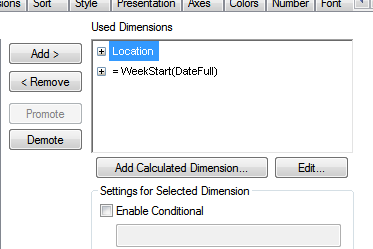
I have a chart and the x axis is: WeekStart(DateFull)
DateFull is able to be selected as Year, Month, week, day
I want to automate a bookmark or create a button???
Presently the user can select the week and the chart responds appropriately.
However in order to automate I want the chart to show the x axis from:
WeekStart(today() to WeekStart(Today() + 56) ie a total of 8 weeks
The idea is to eventually email this weekly!
Thank you
Jo
- « Previous Replies
-
- 1
- 2
- Next Replies »
- Mark as New
- Bookmark
- Subscribe
- Mute
- Subscribe to RSS Feed
- Permalink
- Report Inappropriate Content
This is the where I have set the dimension
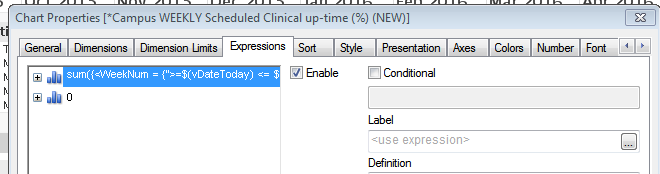
this is the expression I have used:
sum({<WeekNum = {">=$(vDateToday) <= $(vDateNT)"}}>}DurMins)
I am sorry for being so paranoid, but I work in health and privacy is ingrained.
- Mark as New
- Bookmark
- Subscribe
- Mute
- Subscribe to RSS Feed
- Permalink
- Report Inappropriate Content
May be include the weekstart function into your set expression...Like
=sum({<DateFull={">=$(=Today())<$(=WeekStart(Date(Today()+56)))"}>}DurMins)
in your expression
sum({<WeekNum = {">=$(vDateToday) <= $(=WeekStart($(vDateNT)))"}>}DurMins)
- Mark as New
- Bookmark
- Subscribe
- Mute
- Subscribe to RSS Feed
- Permalink
- Report Inappropriate Content
Cool . You can also create an another field like WeekStart(DateFull) as WeekStart in your load script (Like you created for WeekNum) and use expression as
sum({<WeekStart = {">=$(vDateToday)<=$(vDateNT)"}>}DurMins)
- « Previous Replies
-
- 1
- 2
- Next Replies »